Education in India has always been characterized by paradox and contradiction: tales of substantial growth, juxtaposed with serious inequality. The National Sample Survey Organization (NSSO) was commissioned by the National Statistics Office (NSO) under the Ministry of Statistics and Programme Implementation (MoSPI) to conduct the Comprehensive Modular Survey: Education (CMS:E) from April – June 2025. It was a part of the 80th round of the National Sample Survey (NSS) and was developed to capture comparative information on the different facets of education in India such as enrolment, attendance, expenditure and access to educational inputs.
It provides new insights into this paradox, letting us know precisely where we have done well, where gaps remain, and where we need policy change and or intensification of attention. Data arrays in the NSS survey transform complicated realities into measurable realities through educational inputs. It provides new insights into this paradox, letting us know precisely where we have done well, where gaps remain, and where we need policy change and or intensification of attention. Data arrays in the NSS survey transform complicated realities into measurable realities through distinct tables and figures. Here, we consider these numbers in artisanal ways like stories based on variables.
Literacy rates are increasing
NSS data show steady increases in literacy, with younger cohorts being nearly universally literate, while older cohorts make up a much smaller segment of the literate population. This is due to years of sustained campaigns, for example, the Right to Education Act, and decades of literacy interventions. At the same time, it remains the case that men are more likely to be literate, however, the gap has narrowed considerably in the last two decades. For example, while older (60 and above) women fall below 50% in terms of literacy rates, younger (15 – 24) women approach almost 90%.
While rural literacy rates are lower than urban literacy rates, the rural literacy curve is also sharper, suggesting they are catching up to the urban cohorts.
Current enrolment: Rural versus Urban
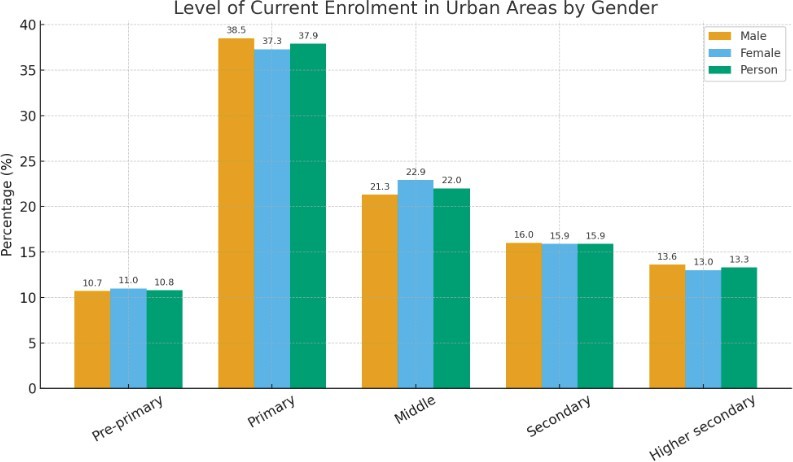
A fascinating table in the NSS makes a direct comparison of current enrolment for all educational levels, both urban and rural. At rural level, primary school outweighs, with 43% of enrolled students in primary. Middle school accounts for 22%, while secondary and higher secondary combined would represent about 25%. The number in pre-primary still accounts for a small 10%. In urban areas, the primary share is lower at 38%, but higher education stages have more value. For example, for urban students, 13% of urban students are already in higher secondary, compared to 10% for rural students. In rural India, the education pyramid is wider at base, most children land in primary school. Urban India stretches the pyramid higher since more students are extending into secondary and higher secondary.
Expenditure on Education
In rural parts of India, the yearly average spending per student on school education was ₹2,639 in government schools and ₹19,554 in non-government schools in the current school year. This demonstrates how much more affordable government schools are for rural families than private schools, which create a considerable financial burden.
By comparison, in urban India, the average per-student cost of schooling was even greater. Spending was ₹4,128 for government schools and ₹31,782 for non-government schools. The costs in urban areas continued to illustrate that while government schools remain a more financially viable option, the expense of schooling was greater in urban areas because of additional fees, costs of the schools’ infrastructure, and societies with higher living expenses. Finally, the rapid increase in costs for attending non-gov- ernment schools, urban or rural, signals the commercialization of education and increasing inequality for families choosing a public versus a private school.
In rural India, the average expenditure per student for schooling across all enrolment levels and all types of schools was estimated to be ₹8,382 as compared tob ₹23,470 in urban India. This discrepancy captures both the rural-urban difference in accessing resources and facilities and the difference in cost structures. In rural areas, educational spending is less as the school costs are relatively lower, there are fewer add-on costs, and there is little or no access to private schools. In urban centres, however, the spending is nearly triple that of rural areas, primarily based on higher tuition fees, add-on costs, transport charges, uniforms, books, and digital learning devices, as well as the higher prevalence of private schooling, where parents pay a premium for their children to attend a perceived private or better education.
One NSS table on course fees expenditure shows the inequality quite clearly. For the pre-primary group, roughly 46% of students (overall male + female average) paid course fees; by the secondary level, that jumped to 76% of students paying fees and at the higher secondary level almost 86% of students reported expenditure on fees.
There are also gender disparities: at the higher secondary level, 88.5% male students reported paying fees while 82.9% of female students reported paying fees, thus also showing gender differences in course fees.
As a student climbs the educational ladder, however, it gets more expensive. By the time a rural or urban child reaches Class XI, 90% of families are paying fees. For the very poor, this transition does not feel like climbing an educational ladder, feels more like climbing an educational wall.
Dropout and Retention: Where We Are Losing Students
Dropout data is one of the most sobering elements of the survey. While enrolments are strong, retention falls off markedly after middle school. Concerning rural girls, the drop-out rates increase signifi- cantly after the age of 14, often due to home responsibilities, safety issues, and marriage. Urban locations may be better off, but dropout rates are known to rise between the transition of secondary school and higher secondary school.
Imagine 100 children enter Class I on the first day of school. By the time they reach Class X, in rural India, only about 60 of those children are in school, fewer still will be in Class XII. In urban areas, that number may be closer to 75, but the cracks will remain.
Note: Views expressed are personal and do not reflect the official position or policy of the Clear Cut Magazine.
Clear Cut Education Desk
New Delhi, UPDATED: Dec 29, 2025 05:14 IST
Written By: Antara Mrinal