

India’s official data tell two stories at once. UDISE+ 2025-26 records 26 crore students, falling dropout and pupil-teacher ratios comfortably inside policy targets. PLFS 2025 records graduate unemployment at 11.2 percent against a national rate of 3.1 percent. Between those two numbers sits the question that will define the next decade: whether an expanding system is converting attendance into learning and learning into work. The evidence says partly, unevenly, and not yet fast enough.
Two numbers, released ten months apart by two arms of the same government, describe two different countries. In July 2026, the Ministry of Education published the UDISE+ report for 2025- 26. It counted more than those 1.48 million schools over 26 crore students and 1.02 crore teachers. The transition rate from the middle to the secondary stage had risen to 88.3 percent from 86.6 percent the previous year. Secondary-stage dropout had fallen to 7 percent, from 13.8 percent in 2022-23. The pupil-teacher ratios stood at 10, 12, 17 and 21 across the foundational, preparatory, middle and secondary stages, all well inside the 30:1 ratio that
the National Education Policy of 2020 recommends (Ministry of Education, 2026).
In March 2026, the Ministry of Statistics and Programme Implementation published the Periodic Labour Force Survey for the calendar year 2025. It found overall unemployment among those aged 15 and above at 3.1 percent. Among graduates it was 11.2 percent, and among postgraduates, 10 percent. Rural graduates fared worst of all, at 11.8 percent against 10.6 percent for their urban counterparts. A young Indian is therefore more than three times as likely to be unemployed after completing a degree than the average adult is without one. This is not an exaggeration. It is the arithmetic of two official surveys, and it is the central fact of Indian education today.
India’s education system has largely solved the problem it set out to solve forty years ago, which was getting children into classrooms and keeping them there. The problems it has not solved concern what happens inside those classrooms, who benefits from it, and whether the qualifications issued at the end command value in an economy that is not creating enough of the jobs graduates are trained to want.
The expansion of educational opportunities
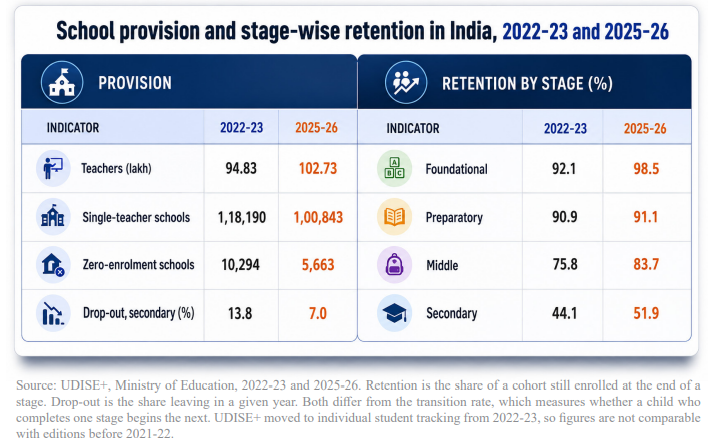
The scale of what has been built deserves to be stated plainly, because it is often skipped. Teacher numbers crossed one crore for the first time in 2024- 25 and stood at 1.02 crore in 2025-26, an increase of 8.3 percent over 2022-23, when the figure was roughly 94 lakhs. UDISE+ 2025-26 also records a continuing decline in both zero-enrolment schools and single-teacher schools, a more significant achievement than it sounds (Ministry of Education, 2026). A single-teacher school is a school where multi-grade teaching is not a pedagogical choice but a staffing necessity.
Transition has improved at every stage measured. The foundational-to-preparatory rate reached 99.2 percent in 2025-26, preparatory-to-middle 93.8 percent and middle-to-secondary 88.3 percent. The steepest improvement is at the move into secondary education, and dropout has fallen alongside it, from 13.8 percent in 2022-23 to 7 percent in 2025-26. UDISE+ attributes part of this to a larger number of schools now offering secondary classes, which is an infrastructure explanation for a behavioural outcome. Retention, however, is the more demanding measure: it asks how much of a cohort is still enrolled at the end of a stage rather than whether a child crossed into it. On that measure the secondary stage stood at 51.9 percent in 2025- 26, up from 44.1 percent in 2022-23 (Ministry of Education, 2026). Most children who finish middle school now start secondary school. Unfortunately, roughly half of them do not finish it.
Higher education has expanded in parallel. The All India Survey on Higher Education for 2023- 24, released in July 2026, records total enrolment of 4.50 crore, against 3.42 crore in 2014-15, a rise of 31.5 percent over the decade. The Gross Enrolment Ratio in higher education reached 30, a measure of participation among 18 to 23-year-olds. It is far below the school-stage ratios in UDISE+, and the two should never be set side by side. Within higher education, female GER stood at 31.2 against male GER of 30.0, giving a Gender Parity Index of 1.08. AISHE also records enrolment growth among Scheduled Caste, Scheduled Tribe and Other Backward Class students, and women’s participation in STEM fields at 44 percent (Department of Higher Education, 2026).
Learning, too, recovered from the pandemic. ASER 2024, Pratham’s household survey covering 649,491 children aged three to sixteen across 17,997 villages in 605 rural districts, found not only a full recovery from pandemic-era learning loss but primary-grade learning levels above their pre-pandemic marks (Pratham Education Foundation, 2025), Although this survey covered only the rural area.
Access is not the same as learning
A large share of Indian families is paying twice for schooling. The Comprehensive Modular Survey: Education, conducted between April and June 2025 as part of the 80th round of the National Sample Survey, covered 52,085 households and 57,742 students. It found that 27 percent of all school students were taking or had taken private coaching in the current academic year, rising to 30.7 percent in urban areas against 25.5 percent in rural ones. Coaching expenditure climbs with each stage of schooling, from Rs. 525 per student at preprimary to Rs. 6,384 at higher secondary. In urban areas, higher-secondary coaching costs an average of Rs. 9,950 per student per year, against Rs. 4,548 in rural areas (MoSPI, 2025).
More than a quarter of Indian schoolchildren are enrolled in a parallel, fee-charging system running alongside the free one.
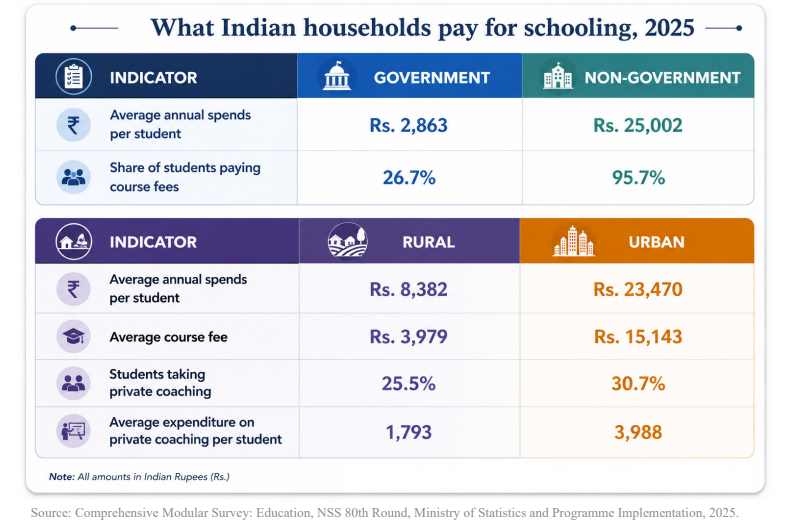
The same survey exposes how uneven the paid system is. Average household spending per student was Rs. 2,863 a year in government schools and Rs. 25,002 in non-government schools, close to nine times higher. Only 26.7 percent of government-school students paid course fees at all, against 95.7 percent in non-government schools and 98 percent in urban private unaided schools. Course fees are the single largest household education expense, averaging Rs. 7,111 nationally but Rs. 15,143 in urban areas against Rs. 3,979 in rural ones. Overall, urban households spent Rs. 23,470 per student against Rs. 8,382 in rural households (MoSPI, 2025).
Government schools still carry the majority of the load: 55.9 percent of enrolment nationally, 66 percent in rural India, but only 30.1 percent in urban India. ASER 2024 records a related movement. The share of rural six-to-fourteen-year-olds in government schools rose from 65.6 percent in 2018 to 72.9 percent in 2022, then fell back to 66.8 percent in 2024 (Pratham Education Foundation, 2025).
So, households outside the government system pay nearly nine times more per student. The obvious question is what that buys. ASER 2024, which tests children at home rather than in school, provides the only direct answer available.
Two findings sit in the table below, and they point in opposite directions. The first is genuinely good news. Std III reading in government schools reached 23.4 percent in 2024, the highest since ASER began in 2005. Std III subtraction rose to 33.7 percent nationally from 25.9 percent in 2022. Government schools drove both improvements, and on the Std V reading measure the government-private gap narrowed from 20.9 percentage points in 2018 to 14.5 in 2024, because government schools recovered fully to their pre-pandemic level while private schools did not. Given a nine-fold difference in what households pay, a 14.5-point learning gap that is closing is a striking result.
The second finding is the level itself. Fewer than a quarter of Std III children in government schools can read a Std II text. Fewer than a third can subtract. By Std VIII, arithmetic performance has barely moved in six years, from 44.1 percent in 2018 to 45.8 percent in 2024. These are the highest figures ASER has recorded, and they still describe a majority of children who cannot do what their grade expects.
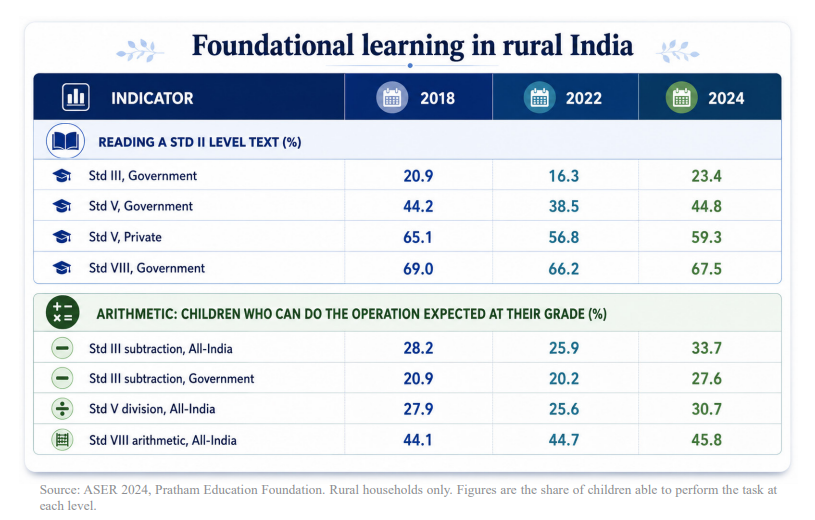
Note what these figures do and do not prove. The comparison between government and private outcomes is not an apples-to-apples comparison: children in private schools differ systematically from those in government schools in household income and parental education, and ASER does not control for this. The narrowing gap is a real measurement. Any claim about which system teaches better is not possible to extract from this evidence.
Education, employment, and the qualification paradox
Return to the Periodic Labour Force Survey (PLFS 2025) numbers, because they are the sharpest instrument available. The headlines are unremarkable. Unemployment stood at 3.1 percent for those aged 15 and above. Youth unemployment among fifteen-to-twenty-nine-year-olds fell below 10 percent for the first time in four years, to 9.9 percent. Unemployment among the educated, defined as secondary and above, fell to 6.5 percent from 7.0 percent in 2024. Break the unemployment figure down by education, and it reverses. Graduate unemployment stands at 11.2 percent and postgraduate at 10 percent, against a national rate of 3.1 percent. Unemployment rises as you climb the education ladder, and it rises fastest at the top. The state spread is wider still, from 40.0 percent among female graduates in Arunachal Pradesh to 5.5 percent in Gujarat, though estimates for the smaller states rest on limited samples and should be read as indicative. The sharpest divide is by gender: 17.4 percent of graduate women and 16.8 percent of postgraduate women are unemployed (MoSPI, 2026, Table 24).
Unemployment stands close to zero among the non-literate population. That is not because illiteracy produces employment. It is because people without education cannot afford to be unemployed and take whatever work exists, whereas graduates can wait, and do. Data For India notes that India’s graduate unemployment rate is almost three to five times higher than in richer economies.
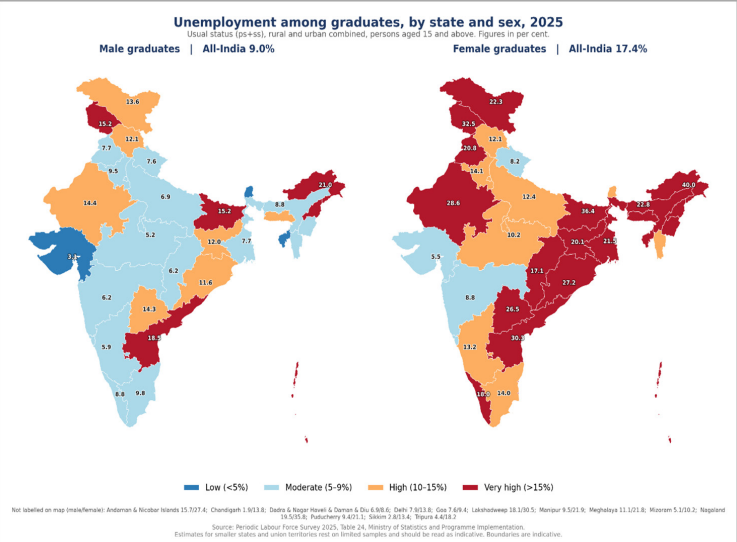
The paradox of demand and supply is the most important domain to comprehend. The first is a supply-side reading: the skills employers demand. The second is a demand-side reading: the economy is not generating enough formal jobs of the kind graduates train for. PLFS 2025 reveals the second reading real support. Regular wage or salaried employment rose only from 22.4 percent of workers in 2024 to 23.6 percent in 2025, while self-employment fell from 57.5 percent to 56.2 percent. More than half of India’s workforce remains self-employed. The formal job market that a graduate degree is designed to enter is small and growing slowly.
Fairness requires noting the counter-reading. An analysis records employment among graduates rising from 49.7 percent in 2017-18 to 57.5 percent in 2023-24 (Directorate General of Employment, 2025). Both claims can be true: more graduates are working than before, and graduates remain far more likely to be unemployed than non-graduates. These measure different things, one a level and one a rate. Male labour force participation among the highly qualified is high, at 88.2 percent for diploma or certificate holders, 86.9 percent for graduates and 88.6 percent for postgraduates (MoSPI, 2026). Male graduate employment, by contrast, is 79.1 percent. The gap between the two is the share who are in the market and not in a job. Educated men are not withdrawing from the labour force; they are waiting inside it.
Gender progress, and the disparities inside it
Female GER in higher education now exceeds male GER, at 31.2 against 30.0 in AISHE 2023-24, with a Gender Parity Index of 1.08. In schools, UDISE+ 2024- 25 recorded girls at 48.3 percent of enrolment and women at 54.3 percent of the teaching workforce. On enrolment, the gap has effectively closed.
PLFS 2025 puts female labour force participation among those aged 15 and above at 40.0 percent, against 79.1 percent for men. Data For India finds that only four in ten graduate women are in the labour force, and that a large share of those outside it, at every age, cite domestic and care commitments. Urban female unemployment stood at 6.4 percent in 2025, against 4.2 percent for urban men (MoSPI, 2026; Data for India, 2025). So, women are now arginally ahead of men in reaching higher education and dramatically behind in converting it into paid work. The gap is not in enrolment. It is in what happens after graduation, and the reason women themselves give is unpaid care. It is also in what happens after that. Sorting India’s workers by occupation shows women reaching the qualified professions and stopping short of leading them.
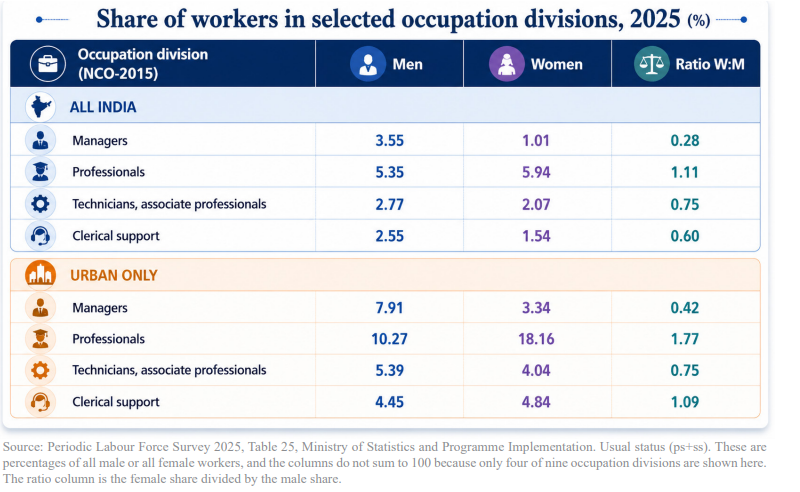
Urban women are considerably more likely than urban men to work as professionals, at 18.16 percent of female workers against 10.27 percent of the male counterpart. They are less than half as likely to work as managers, at 3.34 percent against 7.91. The same women who are over-represented among doctors, lawyers, teachers and engineers are under-represented among those who lead the organisations employing them. Nationally, managers account for 1.01 percent of women workers against 3.55 percent of men (MoSPI, 2026).
The national averages also conceal a very wide state spread. Among female graduates, the share in work ranges from 65.1 percent in Meghalaya to 15.6 percent in Bihar. The situation is worse still in Delhi. India’s capital holds one of the densest concentrations of white-collar employment in the country, and only 19.4 percent of its female graduates are in work, against 66.7 percent of its male graduates. Whatever is keeping educated women out of paid work in Delhi, it is not a shortage of the kind of jobs graduates train for.
On STEM, one figure is available: women are 44 per cent of enrolment in science, technology, engineering and mathematics (Department of Higher Education, 2026). It says nothing about whether the expansion is producing innovation or additional credentials.
On NEP 2020, AISHE 2023-24 carries the first systematic implementation metrics, collected through a new NEP module covering 1,278 responding universities. Four years after the policy, 56 percent introduced the four-year undergraduate programme, 49 percent offered multiple entry and exit, 45 percent offered multidisciplinary degrees, and 69 percent had registered on the Academic Bank of Credits portal (Department of Higher Education, 2026). These are administrative acts rather than classroom outcomes, and we have to wait a few years to assess the implementation and utility of this model.
The pathways ahead
The evidence points to a short list of priorities, and not one of them is about building more schools where schools already stand. The task now is to shorten the distance between the desk and the career. Each of the priorities below is stated with the evidence that produces it and the action it implies. Make the graduate transition an explicit target: Graduate unemployment is 11.2 percent against a national rate of 3.1, and 56.2 percent of workers remain self-employed (MoSPI, 2026). Skilling alone cannot close a gap that is partly about how few formal jobs exist. India needs verified placement outcomes at twelve and twenty-four months, internships inside professional degrees, and education policy coordinated with the industrial policy that decides whether jobs exist.Indian Education System
Give vocational pathways the standing their outcomes justify: Unemployment among the vocationally trained is 7.0 percent for men and 7.1 for women, against 9.0 and 17.4 for graduates (MoSPI, 2026). The age bands differ and the groups overlap, so the contrast is suggestive rather than controlled. It still warrants credit transfer between diplomas and degrees, and outcomes for both published together.
Name a target for female graduate employment, not enrolment. Female GER is 31.2 against 30.0 for men, yet only 32.4 percent of female graduates work against 79.1 percent of male graduates, ranging from 65.1 percent in Meghalaya to 15.6 in Bihar (MoSPI, 2026). Delhi, at 19.4 percent, cannot be short of graduate jobs. Childcare, transport and re-entry practice are where the answer lies.
Read the coaching economy as a diagnosis: On 15 August 2026 the Prime Minister announced free online coaching for competitive examinations, calling coaching a burden on poor and middle-class families, alongside AI training for one crore youth. No scheme document has followed yet. It accepts the diagnosis these figures support. Whether it addresses why the parallel system exists is another matter: free coaching may relieve household budgets while entrenching the premise that school day alone is insufficient. Measure it by falling total coaching expenditure, not by uptake of the free platform.
What would success look like by 2035? Not a higher enrolment ratio, which India will reach anyway. It would be Grade 3 competency at grade level in most districts, graduate unemployment below the national average rather than triple it, female graduate employment above 50 percent, and coaching expenditure falling because school became sufficient.
India built the largest school system in human history and filled it. The generation now sitting in those 1.48 million schools will not be judged by whether they enrolled, because almost all of them did. They will be judged by what they can do at the end of it, and by whether the economy has anywhere to put them.
About the Author:
Dr. Sushanta Kumar Banerjee is a public health expert with over three decades of experience spanning research, policy, and programme implementation. He holds a PhD in Demography and a master’s degree in Economics, bringing a strong analytical lens to complex development challenges. He recently retired as Chief Technical Officer at Ipas Development Foundation. Dr. Banerjee has authored multiple research papers in peer-reviewed international journals and UN publications, and has contributed economic analyses to the Economic and Political Weekly (EPW). He is also a contributing author to Clear Cut.
Clear Cut Education Desk
New Delhi, UPDATED: October 28, 2026 16:00 IST
Written By: Dr. Sushanta Kumar Banerjee