Photo Credit: Antara Mrinal
Clear Cut Livelihood Desk
New Delhi, UPDATED: Oct 09, 2025 04:55 IST
Written By: Antara Mrinal
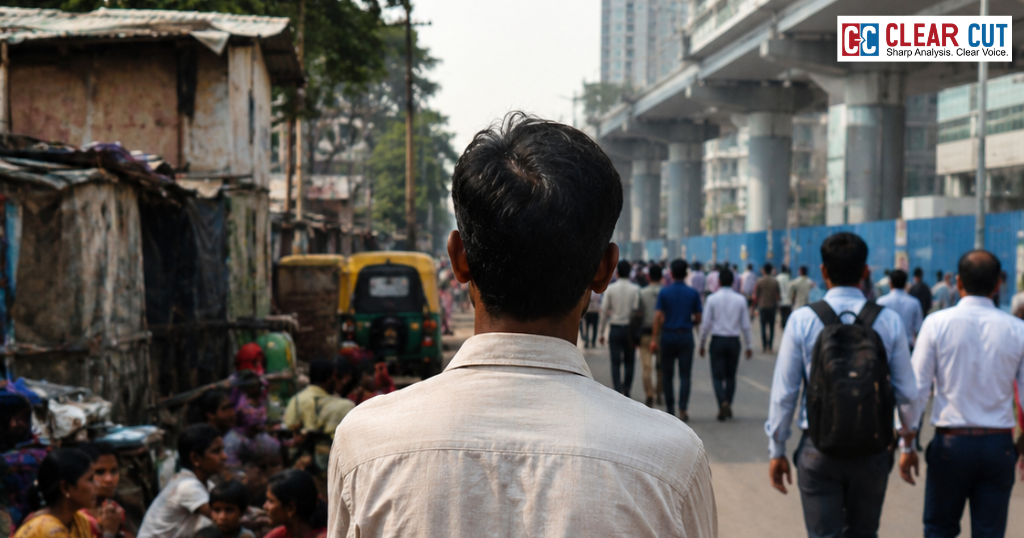
As urbanization reaches the world stage, the true test of city planners is no longer just how to build more quickly, but how to build more equitably. Sustainable Development Goal 11 implores that cities be inclusive, safe, resilient, and sustainably built. It is a hefty request, requiring us to think about three linked lenses – accessibility for persons with disabilities, gender-safe transportation, and housing that is comfortable for migrants. Data across the globe reveals the extent of the challenges and the data at the national level shows how India fits into that narrative – sometimes quite good, but mostly quite poor – and a growing number of city-level experiments that provide us with way-finding in how we might do inclusion well.
The numbers that frame the problem
Around the world, disability impacts roughly one in six individuals, or about 1.3 billion people, and this figure is increasing with the ageing of the population and more people developing non-communicable diseases, which means that accessibility is a mass policy issue and not a niche one. In contrast to the global data, Indian government sources have long reported much lower prevalence. The Census 2011 recorded about 2.68 crore persons with disabilities, or approximately 2.2% of the population. This discrepancy is typically ascribed to definitions of disability and under-reporting, and despite different opinions among surveys and academic articles on true prevalence, they generally agree that their estimates are consistent with the Census 2011 figure, that the Census 2011 figure is significantly lower than the global WHO benchmark for India. These numbers are important because under-reporting leads to under-resourcing where it is needed (World Health Organization).
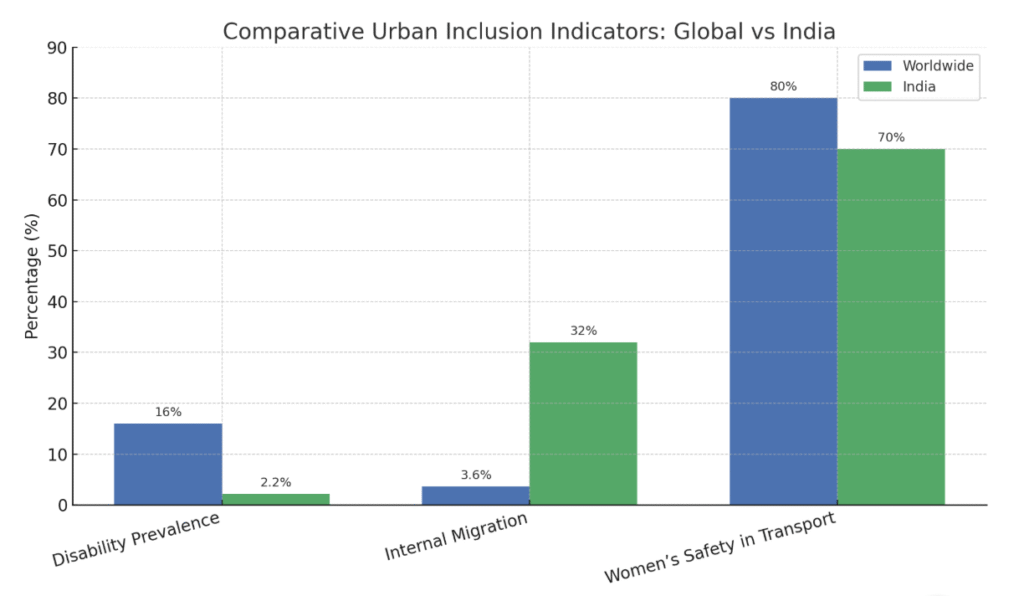
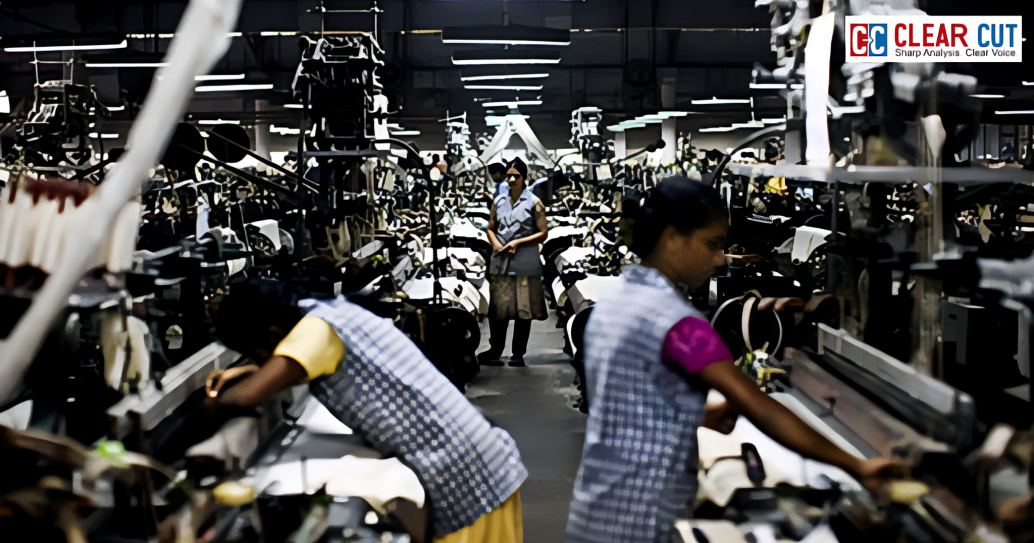
Migration adds another layer. The United Nations estimates about 281 million international migrants as of 2020, however, internal migration is much higher in many countries. India’s Census 2011 recorded about 453.6 million internal migrants, which is nearly 1/3 of the population, representing movement due to marriage, work, and long-term relocation. In megacities and small cities alike, migrants create invigorated economic life; however, migrants tend to access insecure tenure, developing overcrowded housing, and lack of access to services. Thus, intentional, inclusionary housing policy will be needed (United Nations).
The travel patterns of women and harassment they face together are the third leg of the triangle. While more research by the UN and World Bank in regions of the globe shows instances of harassment on public transportation, often over 80% of women in cities experience or witness harassment on public transportation and fear of harassment limits women’s choices and livelihood options in transportation as a public good. In India, for example, the World Bank comprehensive, gender-responsive urban mobility toolkit determines women experience multiple “chained” daily trips and therefore require different forms of planning than standard commute models; Indian cities have attempted to respond, but the degree of change is so great (and uncertain) it is hard to ignore the planned processes (data.unwomen.org).
Designing accessibility into the fabric of cities
Accessibility does not simply involve the availability of ramps. Successful cities incorporate universal design into transportation systems, streetscapes, public buildings, and communications.
- Barcelona and Singapore have demonstrated steady, systematic investment into their transit system, streetscapes, public buildings, and their communications. The technical details include tactile paving, audio-visual announcements, low floor buses, and elevators to and from the station. These technical details contribute to a proportionate amount of independence for an individual with disabilities but equally provide benefits to older adults, families with young children and tourists.
- Nagpur Metro in India, a relatively new metro system that has added tactile pathways, ramps and reserved spaces and reported thousands of assisted trips for persons with disabilities, have shown that retrofit and new infrastructure projects can be aligned with accessibility goals, although national compliance and reporting of accessibility has often been inconsistent. Accessibility audits, building permit requirements for universal design standards, and participatory planning processes that center people with disabilities are actionable belief systems cities can scale (World Health Organization).
Making transport safe for women and other vulnerable users
Transportation planning that overlooks safety is planning for exclusion. Building safer transport means designing systems that protect women and vulnerable users through better lighting, surveillance, and inclusive planning. True mobility is achieved only when every passenger feels secure from the first mile to the last.
- Cities from Vienna to Bogotá have redesigned light, sightlines, and the design of stations to lessen fear and even incidence of harassment;
- Mexico City and New Delhi have trialed women-only cars, improved CCTV coverage, helplines and panic buttons, and adjusted schedules to make transportation available and easier for women at night.
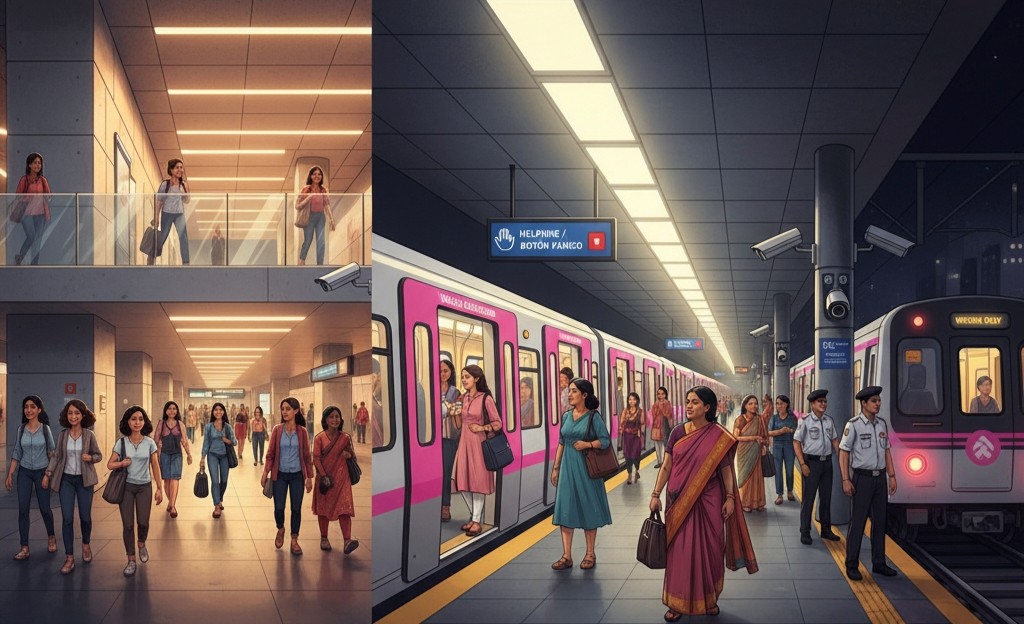
However, these strategies are most effective where they are coupled with institutional changes; more women in transport appointments, better data collection on gendered travel, or stronger reporting mechanisms. In settings where interventions have been taken seriously, studies show increases in women’s ridership and improved confidence to travel at alternate times or routes (itfglobal.org).
Housing migrants into inclusion
Inclusive housing must balance affordability, tenure security and location, within proximity to opportunity.
Cities from Toronto to Berlin have used social housing in conjunction with language, employment and health services in order to impact rates of integration and stabilize hotel environment for vulnerable newcomers.
In the Chinese and Indian context where migrant families often populate older decaying inner-city housing, planners are piloting in-situ upgrades – adding sanitation, child friendly public spaces and safer pedestrian links rather than displacing families. Examples of cooperative housing for informal workers in India and policies to allow incremental upgrade demonstrate that affordable, safe, connected communities are possible if municipal policy and accompanying practice prioritize the needs of residents over short-term profits of redevelopment (PMC).
The change from policies to practices: the way forward
Achieving inclusion at the scale envisioned by SDG 11 necessitates three interrelated changes:
- Data systems disaggregated by disability, gender, and migration status, so cities know “who is excluded” and “where”.
- Regulatory systems to make universal housing design and affordable housing mandatory, along with fiscal liabilities officers tied to measurable outcomes;
- Participatory governance which brings marginalized voices into planning rooms, not only asked as consulters but as co-designers.
The economics is clear: exclusion imposes costly fiscal economic costs, lost participation in labour markets to higher social expenditure, and inclusion has secondary benefits with increased health, mobility, and resilience.
Cities that treat inclusion as an afterthought in design will fail people; cities that embed inclusion in the center of design will prosper. In India and globally, the question is not: “Are inclusive cities designable or desirable?” The question is: “Will political will, money and civic imagination follow?” If they do, SDG 11’s promise that cities be sustainable precisely because they are inclusive, can move from slogan to street.
With inputs from:
- World Health Organization disability factsheet;
- UN DESA migration highlights;
- ITDP/World Enabled “Access for All”;
- World Bank gender-responsive urban mobility toolkit;
- Census of India 2011 migration data.