
Inside the invisible highways of labour that connect the heartland to the metros a data-backed anatomy of who moves, where they go, what they earn, and how the state is finally learning to see them
On the morning of 24 March 2020, when Prime Minister Narendra Modi announced a nationwide lockdown with four hours’ notice, an estimated eight to twelve crore inter-state migrant workers found themselves marooned in cities not their own, without income, without food and with nowhere to go. Hundreds of thousands walked. Some died on the road home. The crisis was not simply a failure of pandemic management it was the violent exposure of a structural fact that India’s policymakers had largely chosen to ignore: that the country’s industrial and urban econom depends, at its foundations, on the continuous flow of labour through a set of well-established interstate corridors, and that the workers travelling those corridors had, for decades, been largely invisible to the welfare state that was meant to serve them. This article is an attempt to draw that map with the most granular government data available, from the Census of India to the Economic Advisory Council to the Prime Minister’s 2024 working paper to the live registration figures of the Ministry of Labour and Employment’s e-Shram portal. The map has always existed. This is what it looks like.
The Scale Problem: Why We Have Been Counting Badly
ndia has the largest internal migrant population of any country on earth, and yet for most of its post-independence history the state has governed as though this population did not move at all. The Census of India 2011 still the most recent full enumeration available as this article goes to press, the 2021 Census having been repeatedly deferred first by the pandemic and then by administrative delay recorded 45.58 Crore of population as internal migrants, defined as individuals whose place of usual residence at the time of enumeration was different from their place of birth or their last place of usual residence . This is 37.6 percent of the population enumerated in 2011. Between the 2001 and 2011 Censuses, the total migrant count grew by 44.9 per cent, nearly two-and-ahalf times the 17.6 per cent growth in the overall population over the same period .
The data gap, however, is real and important. By the time a Census migration table is published, enumerated and analysed, it is typically seven to eight years old. The 2019 release of the D-13 Table from the 2011 Census which for the first time allowed researchers to construct a state-to-state migration matrix based on intercensal migrants with a duration of stay of zero to nine years was the most granular official data release of its kind, and it was describing movement patterns
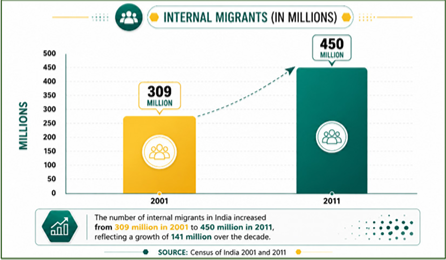
Yet these aggregate figures obscure more than they reveal. Of the 45.6 crore internal migrants recorded in 2011, fully 62 per cent had moved within their own district. Another 26 per cent had moved between districts within the same state. Only 12 per cent roughly 5.4 crore people had crossed a state boundary . It is this last category, the inter-state migrants, who constitute the corridors mapped in this article, and whose movement has the deepest structural consequences for the Indian economy and who face the gravest deficits in social protection, legal recognition and welfare access.
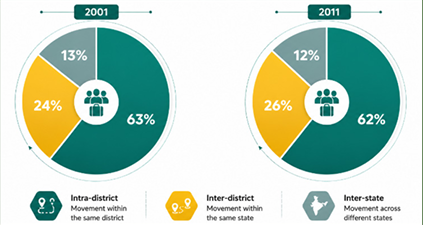
from a decade before its publication . This is the fundamental measurement problem. It is what drove the Economic Survey 201617’s pioneering attempt to use unreserved second-class railway passenger traffic as a real-time proxy for labour migration, and it is what motivated the Economic Advisory Council to the Prime Minister’s (EAC-PM) December 2024 working paper titled “400 Million Dreams!” to deploy three entirely novel high-frequency datasets: Indian Railways Unreserved Ticketing System (UTS) data with over one billion data points, Telecom Regulatory Authority of India (TRAI) roaming subscriber data for three major metropolitan telecom circles, and district-level quarterly banking data from the Reserve Bank of India .
The Anatomy of a Corridor: What Makes a Migration Route Persist
A migration corridor is not simply a pair of states between which people happen to move. It is a selfreinforcing social and economic structure. The first movers typically young men seeking wage work in the city establish footholds: they find employers, learn the local language, identify accommodation and develop reputations. They then become the “node” through which the next wave from their village or district is connected to the labour market at the destination. This is what migration scholars call the network effect, and it is the primary mechanism through which a corridor, once established, tends to deepen rather than disappear even when economic conditions at the destination deteriorate.
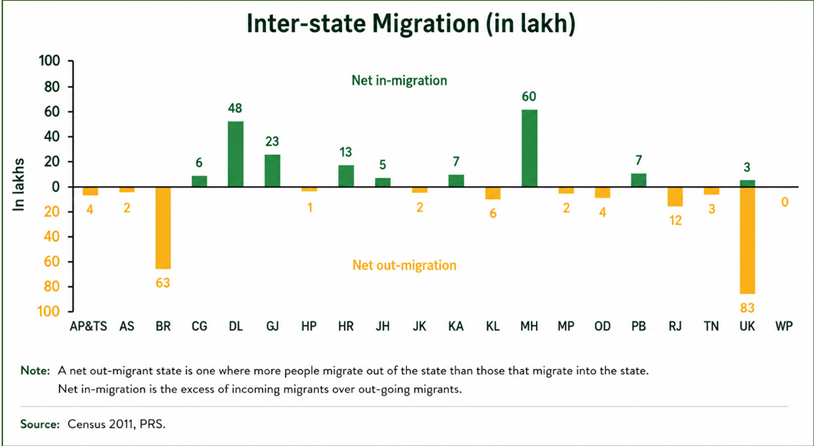
The EAC-PM’s high-frequency analysis, drawing on UTS II Class (unreserved) ticket booking data, finds that even within this concentrated distance pattern, shortmigration dominates: migration flows are strongly attenuated by distance, consistent with the gravity model, meaning that the bulk of UP’s out-migration goes to Delhi (close), while Bihar’s, having Delhi already partially occupied, extends further into Maharashtra and Gujarat. The major state-to-state dyads identified by the EAC-PM paper are Uttar Pradesh-Delhi, Gujarat-Maharashtra, Telangana-Andhra Pradesh, and Bihar-Delhi . This corroborates and updates the 201617 Economic Survey’s earlier estimate of nine million annual inter-state net flows.
WHY THE GENERAL COMPARTMENT MATTERS FOR DATA
The Economic Survey 2016-17 and the EAC-PM’s 2024 working paper both use the same logical shortcut: that unreserved (“general class”) second-class railway tickets are disproportionately purchased by low-income workers travelling for employment, rather than by tourists or business travellers who use reserved berths or air travel. The Indian Railways issues over eight million unreserved tickets per day through the UTS system, generating more than a billion data points per year. This makes it, according to the EAC-PM authors, “the most granular, high-frequency dataset available to track domestic migration in India.” The model has two important caveats: it captures journeys, not people (so a single worker who returns home for Holi and then travels back counts as two migration “events”), and it captures station-to-station pairs rather than city-to-city pairs, requiring careful geographic aggregation. Within these limits, it is the closest thing India currently has to a real-time migration monitoring system.
The Five Corridors: A Data-Anchored Profile
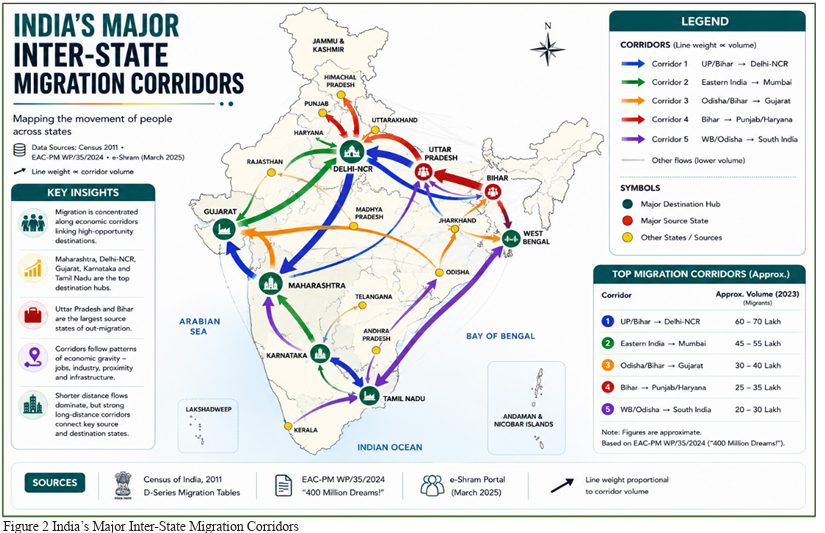
What follows is a profile of each of India’s five major inter-state migration corridors, drawn from Census 2011 migration tables, the Economic Survey 2016-17, the EAC-PM’s 2024 working paper, and e-Shram portal data as on 3 March 2025. Each profile describes the source districts, destination labour markets, dominant sectors, and the economic and demographic logic that sustains the flow.
Corridor 1: Uttar Pradesh → Delhi-NCR (India’s largest single corridor)
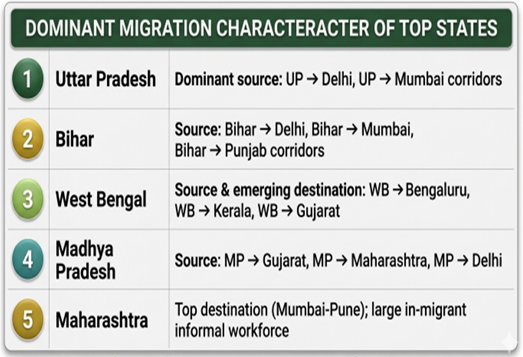
This is the most heavily trafficked inter-state migration route in India by volume. Census 2011 data shows that approximately 83 lakh residents of Uttar Pradesh had moved to other states at the time of enumeration more than any other state in the country . The National Capital Region is the overwhelmingly dominant destination, capturing a disproportionate share of that flow. Delhi alone received an estimated 4.7 million inter-state migrants by 2011, roughly 13 per cent of the country’s total inter-state immigration.10 The EAC-PM’s UTS analysis identifies the Uttar Pradesh–Delhi dyad as the single largest state-to-state movement pair in the country.
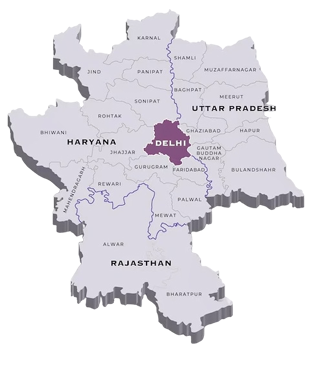
The occupational composition of this corridor is predominantly lowskilled: construction (the Delhi Metro and the NCR’s permanent residential and commercial building boom have been the largest single employer), retail trade, transport (auto-rickshaws, delivery, trucking), domestic work and hawking. A significant share of migrants on this corridor are shortterm and circulatory they return to their villages for the kharif sowing season (June-July) and for major festivals, producing the seasonal railway congestion that is among the most visible manifestations of India’s migration system. The EAC-PM working paper’s TRAI roaming data for Delhi confirms sharp seasonal troughs in the visiting subscriber count corresponding precisely to these festival periods.
Corridor 2: Bihar and Eastern UP → Maharashtra (Mumbai-Pune belt)
Maharashtra has historically been the largest recipient state of inter-state migrants in India by absolute count. Census 2011 records approximately 60 lakh inmigrants to Maharashtra from other states, representing close to 19 per cent of India’s total inter-state inmigrant population . A widespread misconception places Bihar as the primary feeder state for Mumbai. Maharashtra’s surveys own have economic consistently corrected this: Uttar Pradesh, not Bihar, is the largest single source state for migrants arriving in Mumbai. Bihar, while certainly a significant source, ranks behind UP in the Maharashtra-bound flow.
The labour markets this corridor feeds are Mumbai’s highly textile diversified: mills and informal garment manufacturing (historically the entry point for earlier waves of UP migrants), the Dharavi and Kurla smallindustry belts, Pune’s automotive and engineering plants, Thane and Navi Mumbai’s construction sites, and the hospitality and domestic service economy of the two cities’ affluent residential areas. As per NITI Aayog’s Multidimensional Poverty Index (2015-16), poverty levels in Bihar (51.9 per cent) and Uttar Pradesh (37.7 per cent) the primary feeders of this corridor are among the highest in the country, underlining the structural economic imperative that drives the flow.
Corridor 3: Odisha, Jharkhand, Bihar → Gujarat (Surat-Ahmedabad belt)
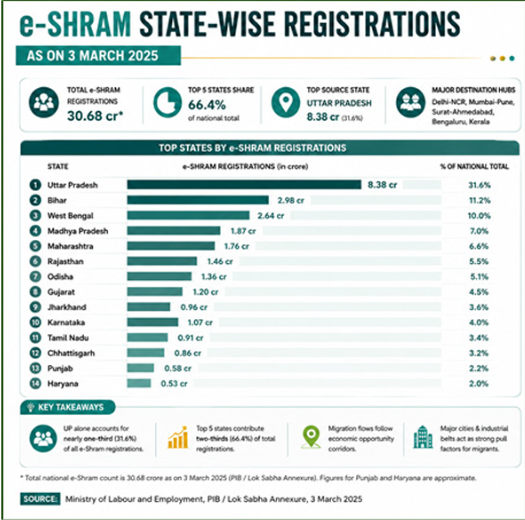
Gujarat’s textile, diamond-cutting, pharmaceutical and chemical industrial clusters around Surat, Ahmedabad, Vapi and Ankleshwar have, since the 1990s, drawn labour from a geographically wide source area: Odisha (particularly the southern and western districts of Koraput, Gajapati, Bolangir and Nuapada), Jharkhand (where the Mining and Industrial Zone has simultaneously created local employment and failed to absorb the population pressure), Bihar, and eastern Rajasthan and Madhya Pradesh. Odisha’s e-Shram registration count of 1.36 crore, combined with Jharkhand’s 96.37 lakh, reflects large unorganised workforces whose most productive members are frequently absent in Gujarat.
This corridor is the most visibly circulatory of India’s major migration flows. Academic studies of Surat’s migrant population have found that a significant share of workers in the textile and diamond sectors maintain two residences, one at the destination and one in the village, dividing the year between employment and agricultural seasons. The scale of the reverseflow was made catastrophically visible in March-April 2020, when images of thousands of Surat’s migrant workers converging on railway stations and highways to return to Odisha, Jharkhand and Bihar became the defining humanitarian images of India’s pandemic response.
Corridor 4: Bihar → PunjabHaryana (the agricultural belt)
This is the oldest of India’s inter-state labour corridors, and in some respects the most underappreciated. Agricultural labour migration from Bihar to Punjab and Haryana predates Independence. As the Green Revolution transformed agricultural Punjab and Haryana’s economies the 1960s onward, creating large commercial farms with strong seasonal labour demand particularly during paddy transplantation in June-July and wheat harvesting in March-April -Bihar’s surplus agricultural population, displaced by land fragmentation and the absence of non-farm employment, became the primary source of that labour.
By Census 2011, Punjab had a net in-migration from Bihar of significant proportions; today, agricultural economists estimate that Punjabi farms could not function at commercial scale without Bihar’s seasonal migrant workforce.
Punjab’s e-Shram registration count of 57.73 lakh and Haryana’s of 53.47 lakh reflect the scale of the unorganised and partly migrant workforce in these states. Notably, both states’ Periodic Labour Force Survey data consistently show a wage differential with Bihar of between 40 and 80 per cent for comparable unskilled agricultural tasks precisely the income differential that the Harris-Todaro model identifies as the fundamental driver of rural-urban and interregional migration.
Corridor 5: West Bengal, Odisha, Bihar → South India (Bengaluru, Chennai, Kerala)
The southward corridor is the youngest of India’s major migration flows and the one showing the fastest growth in the EAC-PM’s UTSbased analysis. West Bengal, Rajasthan and Karnataka are identified by the EAC-PM working paper as the states showing the maximum growth in percentage share of arriving passengers, with West Bengal emerging as a major new competitor among the top destination states. This reflects several structural changes in the southern economy: the construction boom associated with Bengaluru’s tech-corridor expansion and infrastructure spending; Kerala’s established and substantial demand for migrant workers (estimated at 5 to 5.5 million by the 2020 Kerala Planning Board study); and the manufacturing and SEZ-driven growth of Chennai’s automotive cluster.
Kerala deserves special mention. It is the rare Indian state that is simultaneously a major source of international migrants (to the Gulf) and a major destination of internal migrants from West Bengal, Odisha, Bihar and Assam. As per the Kerala Planning Board’s 2020 study, the state has between 5 and 5.5 million inter-state migrant workers many of them concentrated in construction, plantation labour and fish processing making it one of the largest destination states in per-capita terms despite its relatively small geographic size.
What These Corridors Carry: Sector-Wise Anatomy of India’s Unorganised Workforce
The e-Shram portal’s occupation-wise registration data published by the Ministry of Labour and Employment in a Lok Sabha annexure dated 3 March 2025 provides the most current sector-level snapshot of India’s unorganised workforce. The International Labour Organization has estimated that migrant workers in India contribute approximately 10 per cent of national GDP, with their share rising to 15 per cent in Delhi’s economy and 12 per cent in Maharashtra’s underscoring that the corridors described in this article are not peripheral to the economy but structurally central to it . The table below shows the occupational distribution of e-Shram registrations, which is the closest available proxy for the sectoral distribution of the migrant workforce.
TABLE 1: e-SHRAM OCCUPATION-WISE REGISTRATIONS (3 MARCH 2025) — MIGRANT-RELEVANT SECTORS
Source: Ministry of Labour and Employment, Lok Sabha Annexure, 3 March 2025. Agriculture dominates by volume but the sectors most directly associated with inter-state migration corridors are construction and domestic work.
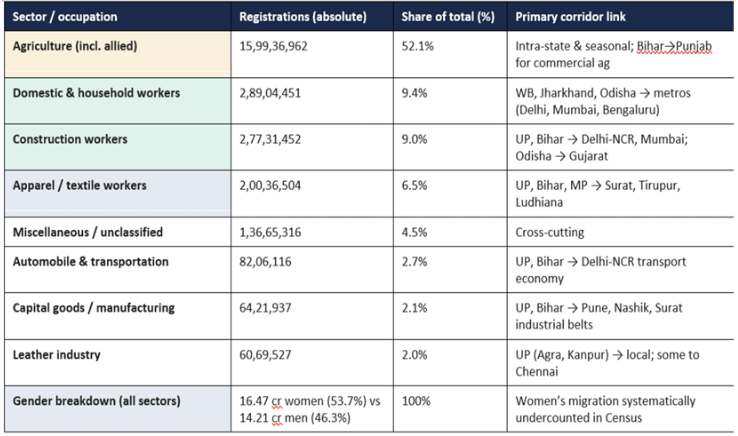
A note on the gender data deserves special attention. The Census 2011 records approximately 50 per cent of female migrants as having moved for “marriage,” against only about 5 per cent moving for “employment.” This almost certainly represents a significant undercounting of female labour migration: a woman who follows her husband to a city and subsequently takes up paid domestic or garment work is recorded as a marriage migrant in the Census, not an employment migrant, because the reason recorded is for the move, not for the activity at the destination. The e-Shram portal’s 53.7 per cent female registration share suggests that the actual female share of India’s unorganised and migrant workforce is substantially higher than Census categories have historically implied .
The Missing Half of the Story: Women and Migration
India’s migration discourse has traditionally been dominated by the image of the male migrant worker travelling to a city for employment. Yet this image obscures the growing importance of women within migration systems. According to the Census of India 2011, women constituted nearly 70 per cent of all internal migrants in the country. However, most female migrants were classified as having moved due to marriage (46.1 per cent) or movement with household members, while only around 2.3 crore women approximately 5 per cent of total female migrants were recorded as having migrated primarily for employment .
This classification reflects the reason for movement rather than economic activity after migration. A woman who relocates after marriage and subsequently joins the workforce as a domestic worker, garment worker, homebased producer, caregiver, or informal entrepreneur remains statistically classified as a marriage migrant rather than an employment migrant.
This creates a significant blind spot in official migration statistics. Evidence from the Ministry of Labour and Employment’s e-Shram portal suggests a substantially larger economic role for women than Census migration categories imply. As of 3 March 2025, women accounted for approximately 16.47 crore of the portal’s 30.68 crore registered unorganised workers (53.7 per cent), exceeding the share of male registrants (46.3 per cent) . While e-Shram registrations do not directly measure migration, they indicate that women constitute a far larger share of India’s informal workforce than conventional migration narratives acknowledge.
Several migration corridors are increasingly feminised. Domestic workers from West Bengal, Jharkhand, Odisha and Assam are employed across metropolitan centres such as Delhi, Mumbai, Bengaluru and Hyderabad. Women from eastern India are also heavily represented in garment manufacturing clusters in Bengaluru, Tiruppur and Chennai, food-processing units in western India, tea plantations in Assam and Kerala, and the rapidly expanding care economy in urban centres. Studies by the International Labour Organization (ILO) and UN Women have noted a gradual increase in female labour mobility linked to urbanisation, expansion of service-sector employment and changing household livelihood strategies.
Female migration also carries distinct vulnerabilities. Women migrants frequently face insecure housing, limited access to childcare facilities, occupational segregation into low-paid sectors, restricted social protection coverage and a heightened risk of workplace harassment or exploitation. The Periodic Labour Force Survey (PLFS) consistently shows that women remain concentrated in informal and vulnerable forms of employment, with lower average earnings than male workers across most sectors.
At the same time, migration can significantly expand women’s economic agency by increasing access to paid employment, strengthening financial decisionmaking within households and improving access to education, healthcare and urban opportunities for the next generation.
Any attempt to understand India’s migration corridors through a purely male lens therefore captures only part of the story. The future geography of labour mobility in India will be shaped as much by the movement of women workers as by menand the policies designed to support migrant populations must increasingly reflect that reality.
The Return Flow: Remittances and the Economic
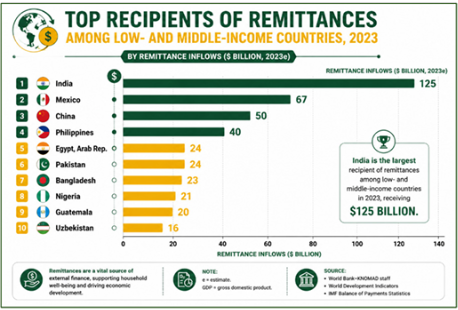
At the international level, India’s position is now well established. According to the World Bank’s Migration and Development Brief, India received approximately USD 135 billion in remittances in 2024, retaining its rank as the world’s largest recipient for the third consecutive year and the only country to have crossed the USD 100 billion mark in three straight years. While the majority of this figure reflects international remittances from the Gulf, the United States and the United Kingdom, it anchors a broader picture in which the same source states that supply India’s internal migration corridors Uttar Pradesh, Bihar, Kerala and Rajasthan are also the largest recipients of international remittances, creating a compounding remittanceto-development dynamic in precisely the districts that are most economically marginalised.
Governing the Invisible: ONORC, e-Shram and the Architecture of Portability
For most of independent India’s history, its welfare state was built around a fixed, address-based conception of citizenship: ration cards were issued at the home village, voter rolls were maintained at the home constituency, employment guarantee cards were registered at the home panchayat. For the tens of millions of workers whose economic lives span two or more states, this architecture was worse than merely inadequate it was actively exclusionary. The 2020 lockdown made this exclusion catastrophically visible. The policy response, though incomplete, represents the most significant structural reform in how India delivers welfare to its migrant citizens since Independence.
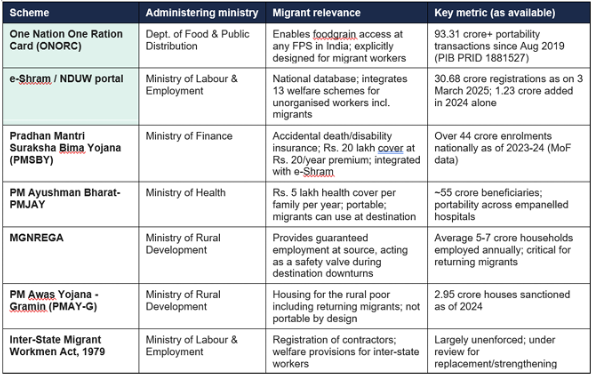
The first and most operationally mature reform is the One Nation One Ration Card (ONORC) scheme, implemented by the Department of Food and Public Distribution under the Integrated Management of Public Distribution System (IM-PDS). Launched on 9 August 2019, ONORC allows any National Food Security Act (NFSA) beneficiary approximately 80 crore individuals covered under NFSA across 36 states and union territories to draw their entitled monthly foodgrain (rice at Rs. 3 per kg, wheat at Rs. 2 per kg for Priority Household card holders, and 35 kg per household per month for Antyodaya Anna Yojana families) from any ePoS-enabled Fair Price Shop in the country, using biometric or Aadhaar-based authentication, irrespective of the state in which their ration card is registered.
The scheme’s uptake data, released through PIB press releases and Lok Sabha replies, is one of the clearest indirect measures available of the actual volume of migration flowing through India’s corridors. A PIB release (PRID 1881527) recorded 93.31 crore cumulative portability transactions under ONORC as of December 2022, within just three years of launch. A separate PIB release (PRID 1847386) noted that approximately 77.88 crore transactions had been recorded by August 2022. The pace of transactions roughly three crore per month as of the most recent available data reflects the depth of the migrant population’s actual use of the system. Critically, ONORC’s design explicitly accounts for the corridor structure: a migrant worker can draw their own share of the family entitlement at the destination, while the family members remaining at the source can simultaneously draw the balance.
THE MERA RATION APP
In recognition of the digital access challenges faced by low-income migrant workers, the Department of Food and Public Distribution developed the “Mera Ration” app, offering Aadhaar-based login, real-time tracking of foodgrain entitlements, transaction history, and a GPS-based locator for the nearest ePoS-enabled Fair Price Shop. The Mera Ration 2.0 update extended these features with improved language support. The app is designed specifically for the migrant use case: a construction worker in Surat from Odisha who does not know where the local Fair Price Shop is can use the GPS locator to find the nearest one and then authenticate biometrically using their home ration card. Notably, 99.8 per cent of all ration cards in India are now Aadhaar-seeded, making this architecture operational at near-universal scale.
by the Ministry, converted it into a “OneStop-Solution” integrating thirteen central government schemes Pradhan Mantri Suraksha Bima Yojana, Pradhan Mantri Jeevan Jyoti Bima Yojana, Ayushman Bharat-PMJAY, MGNREGA, PM Awas Yojana (Gramin and Urban), and the National Career Service portal among them so that a registered unorganised worker can access all these entitlements without reregistering at their destination state.
TABLE 2: KEY SCHEMES FOR MIGRANT WORKERS – STATUS AND SCOPE
Source: PIB press releases; Lok Sabha starred and unstarred questions; Ministry of Labour and Employment; Department of Food and Public Distribution.
A Map That Is Redrawing Itself: Three Structural Shifts to Watch
The corridor map described in this article is not static. Three structural forces visible in the datasets already cited are in the process of redrawing it in ways that will significantly affect both the scale and geography of Indian internal migration over the next decade.
The De-concentration of Migration: Tier-2 Cities as Emerging Destinations
The most striking finding of the EAC-PM’s 2024 working paper is the 11.78 per cent decline in total estimated migrant numbers from 45.57 crore in Census 2011 to approximately 40.2 crore in 2023 alongside a drop in the migration rate from 37.6 per cent to 28.88 per cent of the population. The authors attribute this primarily to improved economic opportunities in smaller towns and Tier-2 cities, which are absorbing labour that previously had to travel to the metros. This is consistent with evidence from the Periodic Labour Force Survey (PLFS) data and with the establishment of industrial clusters under schemes such as Sagarmala, PM MITRA (textile parks) and State Investment Regions in states such as UP, Bihar, Odisha and Jharkhand.
If this trend continues, the next Census may show a migration map significantly more dispersed than the one documented in 2011. The mega-corridors: UP-to-Delhi, Bihar-to-Mumbai are unlikely to disappear, but their dominance within the total inter-state flow may decline as shorter, inter-district corridors to emerging industrial hubs absorb an increasing share of workers who would previously have made the longer journey.
Climate Stress as a New Push Factor
Several of India’s major migrantsource states are simultaneously among the most climatevulnerable in the country. Drawn from the Department of Science and Technology’s 2020 National Climate Vulnerability Assessment Jharkhand (VI 0.67), Odisha (VI 0.63), Bihar (VI 0.62) and Assam (VI 0.61) rank among the eight most climate-vulnerable states in India. The primary drivers of vulnerability in these states include heavy dependence on rainfed agriculture, lack of crop insurance coverage, poor health infrastructure and a high poverty incidence all of which translate directly into push factors for out-migration when monsoon failures, floods or heatwaves reduce agricultural income. In effect, climate stress is acting as an accelerant to economic push factors that already exist, strengthening the very corridors documented in this article even as economic convergence in Tier-2 cities tries to moderate them.
The Gig Economy and Platform Migration: A New Corridor Layer
In December 2024, the Ministry of Labour and Employment launched a Platform Aggregator Module on e-Shram, onboarding Zomato, Swiggy, Blinkit, Uber, Ola, Rapido and Amazon as the first cohort of platforms required to register their gig workers on the national database . This represents an official recognition that a significant and growing share of migrant labour now flows into metropolitan cities not through traditional construction or domestic platforms. The occupational and geographic profile of this new layer of migration is significantly different: younger, more educated, often urban-to-urban rather than rural-to-urban, and far more likely to exercise exit (leaving a city) quickly when conditions change. India’s next Census, whenever it is conducted, will need to capture this layer. So will the e-Shram portal’s analytics. Until it does, a growing and economically significant slice of the corridor system will remain invisible in official data.
“A USD 5 trillion economy built on climate-vulnerable, welfare-invisible migrant labour is not a USD 5 trillion economy. It is a USD 5 trillion liability.”
India has, for the first time in its history, the technical ingredients for a comprehensive and near-real-time system of migration monitoring and welfare portability: the Census’s structural baseline; the EAC-PM’s UTS and TRAI data models for high-frequency flow estimation; the e-Shram portal’s growing registration database; the ONORC system’s Aadhaar-anchored portability infrastructure; and the PLFS’s labour force surveys. What it has lacked, and still largely lacks, is the institutional coordination integrate to these datasets into a single policy-facing picture of who is moving, wh e r e they are going, what they are earning and what protection they are entitled to.
The Inter-State Migrant Workmen Act of 1979 the primary legislative framework governing interstate migrant workers is widely acknowledged, including by the Ministry of Labour and Employment’s own working groups, to be functionally unenforceable; it requires principal employers to register contractors who bring inter-state workers, but the registration process is cumbersome, penalties for non-compliance are trivial and the workers themselves rarely know the Act exists. The replacement legislation that has been discussed since the Labour Code consolidations of 2019–2020 has not yet produced a regime that addresses these gaps adequately.
The 2020 lockdown cost India an immeasurable amount in economic output, human suffering and long-term labour market disruption. Its deepest structural lesson that an economy of India’s scale and complexity cannot afford to govern its largest workforce as though it does not exist has been partially absorbed in the form of ONORC and e-Shram. Whether that lesson translates into the deeper institutional reforms real-time migration data, portable entitlements across all social security schemes, and a rights-based framework for migrant workers that the scale of India’s corridor system demands is the central policy question of the next decade of Indian labour governance. The corridors have always been there. The trains have always run. It is the state’s gaze that is, at last, slowly turning toward them.
Clear Cut Research Desk
New Delhi, UPDATED: July 30, 2026 17:57 IST
Written By: Shivangi Misra
Designation: Assistant Manager – MLE at Devinsights