
New AISHE data by the Press Information Bureau show record growth in universities, enrolment and gender parity over the past decade — but faculty representation, caste and tribal proportionality, and disability access have not kept pace.
India’s higher education system expanded faster in the decade to 2023-24 than in almost any comparable period since independence, according to new Ministry of Education data, as the Press Information Bureau recapped this week. Universities rose from 760 to 1,289, a 69.6% jump, while colleges grew from 38,498 to 48,246 and standalone institutions from 12,276 to 15,221.

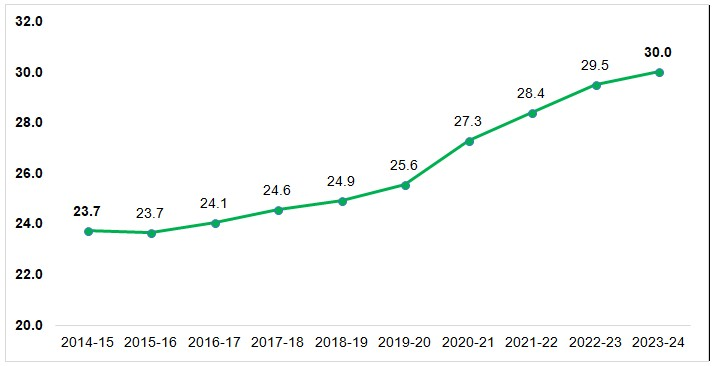
Total enrolment jumped 31.5% to 4.50 crore (45 million) students and improved the Gross Enrolment Ratio (GER)-the percentage of 18-to-23-year-olds participating in higher education-from 23.7% to 30%. But, this is still short of the target of 50% GER by 2035 set by the National Education Policy (NEP) 2020, and lower than the worldwide tertiary average of about 43%, based on World Bank data.
The growth also contributed to India’s knowledge pool. STEM enrolment increased by 91.5 lakh to 1.02 crore, while the proportion of women in STEM rose from 38.4 to 44 percent. The overall count of foreign student enrolment increased by 37.5 percent to 58,134. In the realm of physical facilities, progress was in parallel: by 2023-24, 89 percent plus Indian universities will be equipped with a laboratory, and almost everyone (98 percent) with a library, indicating that the rise in numbers wasn’t merely a quantitative expansion.
Focused entirely on the equity agenda of NEP 2020, the Government’s report card on the decade’s performance is gender-centric. While female enrolment was 42.2% higher than overall enrolment, the Gender Parity Index (GPI, female-GER over male-GER) has been above 1.0 for the last seven consecutive years, at 1.08 in 2023-24, with 31.2% GER for women compared to 28.9% for men.
That progress thins out well before the faculty room. Women make up 44.9% of India’s 17.32 lakh higher-education teachers, up from roughly 38.6% a decade earlier — real movement, but nowhere near the gains among students. The gap widens further up the ladder: AISHE rank-wise data analysed by Ahmedabad University researchers found only 76 female Assistant Professors, 60 Associate Professors, and 40 full Professors for every 100 men at each rank. A 2021 UNESCO-IESALC report found much the same pattern worldwide: women now outnumber men at entry into higher education almost everywhere, yet grow scarcer the higher up the academic ladder one looks.
Reacting to comparable gains recorded in an earlier AISHE round, University Grants Commission chairman M. Jagadesh Kumar credited “targeted scholarships, girls’ hostels, and flexible-learning options” for widening access — a framing that speaks more to entry than to advancement.
Representation of historically marginalised communities grew, too, though unevenly relative to their population shares. Scheduled Caste (SC) enrolment’s share of the student body rose from 13.44% to 15.5%, and Scheduled Tribe (ST) enrolment’s share rose from 4.8% to 6.4%, both still below their respective roughly 16.6% and 8.6% shares of India’s population recorded in the 2011 Census. SC and ST enrolment ratios nonetheless improved substantially, from 18.9% to 27.8% and 13.5% to 22.8%, respectively, and OBC representation climbed fastest of all groups, from 32.8% to 40.1% of the student body.
Disability inclusion lags furthest behind. Enrolment of Persons with Benchmark Disabilities (PwBD) rose 38.1% between 2014-15 and 2022-23, yet reached only 54,080 students in 2023-24 — a fraction of the 4.50-crore total — and skewed male, at 34,080 men to 20,000 women, a gap the Ministry’s own release flags as unresolved.
The summary from the Ministry hails the period as proof NEP 2020 is “fostering quality, inclusion, and excellence”, but the numbers underlying the assertion reveal a more uneven picture: institution-building and access have spread the furthest for those already closest to access and least far for those-women competing for faculty positions, Scheduled Tribes, students with disabilities-for whom the harsher policy pledges still await another nine years. Whether the next AISHE cycle reduces those specific inequalities, rather than merely mirroring the decade’s aggregate performance, will be the more pertinent indicator of the NEP’s commitment to equity.
The decade in numbers, 2014–15 vs 2023–24
| Indicator | 2014–15 | 2023–24 |
| Universities | 760 | 1,289 |
| Colleges | 38,498 | 48,246 |
| Standalone institutions | 12,276 | 15,221 |
| Total enrolment | 3.42 crore | 4.50 crore |
| Gross Enrolment Ratio (GER) | 23.7% | 30.0% |
| Female GER (Male GER) | 22.9% | 31.2% (28.9%) |
| Gender Parity Index (GPI) | 0.92 | 1.08 |
| Female share of teaching faculty | ≈38.6% | 44.9% |
| SC enrolment share (population ≈16.6%) | 13.44% | 15.5% |
| ST enrolment share (population ≈8.6%) | 4.8% | 6.4% |
| OBC enrolment share | 32.8% | 40.1% |
| PwB D enrolment | 64,298 | 54,080† |
† PwBD enrolment peaked at 88,816 in 2022–23 (+38.1% over 2014–15) before the reported figure fell to 54,080 in 2023–24 (34,080 male, 20,000 female), as stated in the source release.
Clear Cut Health Desk
New Delhi, UPDATED: September 03, 2026 18:30 IST
Written By: Yatharth Pathak