
India’s Jal Jeevan Mission has significantly expanded rural tap-water connections, but access does not always mean reliable water security. Drawing on the 2024 functionality survey, state audits and budget data, this article examines gaps in water quality, quantity, regularity, infrastructure maintenance and village-level institutions. It highlights why verified functional water supply must become the measure of progress rather than household tap connections alone.
Why taps do not equal water security: Water Security under the Jal Jeevan Mission, using the 2024 national functionality survey, state audits and budget data. Data as of October 2026 · Survey period July–October 2024
- 82.1%of rural households reported to have a tap, 18 July 2026
- 76.0%of taps in “Har Ghar Jal” villages functional on all three tests, 2024 survey
- ~38%of rural households without verified functional service (illustrative estimate)
Coverage is an output, not a service
India’s rural piped-water mission has made the tap a household fixture in a little over seven years. As of 18 July 2026, 15.89 crore of 19.36 crore rural households (82.09%) were reported to have tap supply, up from 3.23 crore (16.7%) when the Jal Jeevan Mission (JJM) began in August 2019 (MoJS, 2026a). The mission’s own promise, however, is a service: at least 55 litres per capita per day (lpcd) of water that meets the BIS 10500 standard, delivered regularly and over the long term (MoJS, 2026b). A tap that exists is an output. Water security needs adequate quantity, safe quality, reliable timing, a source that does not fail and an institution that can pay for repairs. This note compares what the mission reports with what independent surveys and audits measured, mainly the 2024 functionality assessment by the Department of Drinking Water and Sanitation (DDWS).
The scale of the achievement
The expansion is real. JJM added about 12.66 crore connections in seven years (MoJS, 2026a), and the gains reached poorer districts: tap access in the 112 aspirational districts rose from 7.86% of households at launch to 72.08% by January 2024 (PTI, 2024). The question is no longer whether pipes were laid but whether they deliver (Table 1).
Table 1. Reported rural tap coverage under JJM
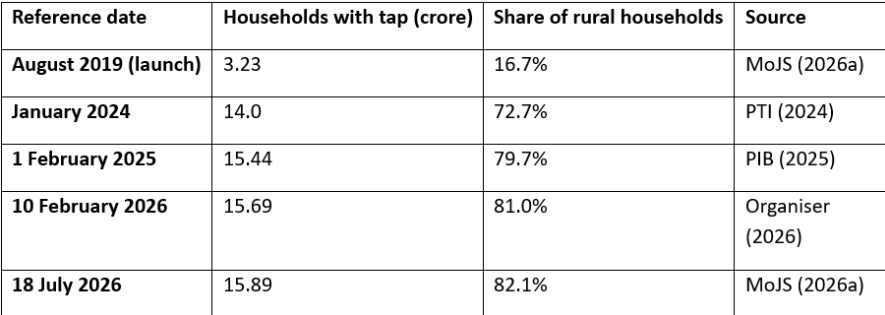
Reported figures are state-reported connections on the mission dashboard, not verified service. Rural households total 19.36 crore.
The verification gap: what the 2024 survey found
The 2024 assessment is the most rigorous test available. Between July and October 2024 an
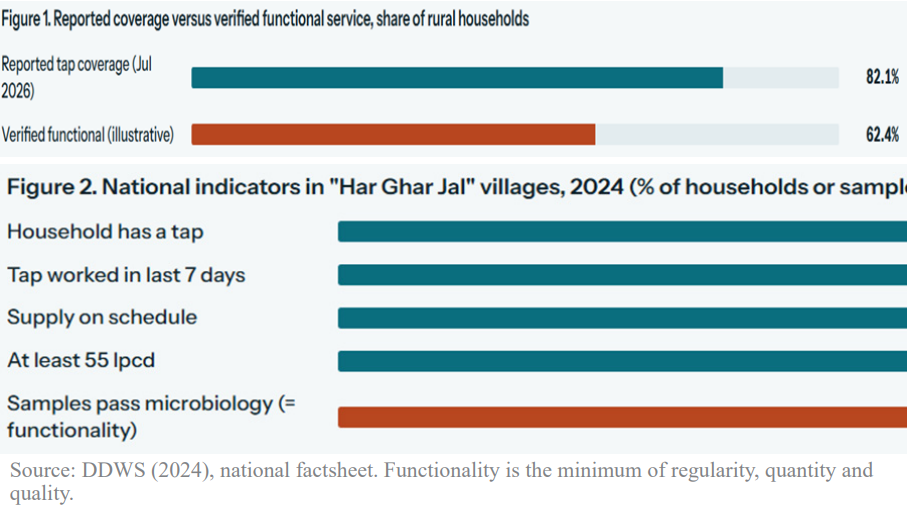
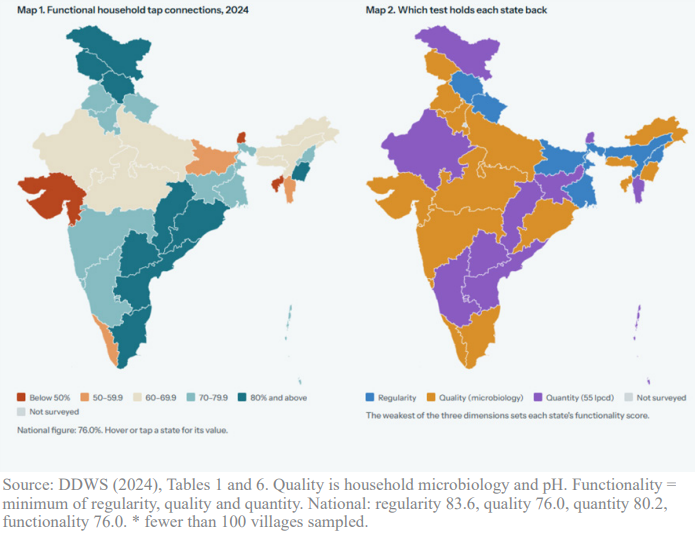
independent agency visited 19,812 villages already declared “Har Ghar Jal”, interviewing 2,37,608 households across 761 districts in 34 states and Union Territories. It measured flow at the tap and tested samples in accredited laboratories (DDWS, 2024). Its definition is strict. A connection is functional only if it delivers at least 55 lpcd, passes microbiological and pH tests, and supplies water on schedule. Because the survey cannot test all three at the same household, functionality is calculated as the lowest of the three state-level figures (DDWS, 2024). Nationally that figure is 76.0%, set by quality: 83.6% of households reported regular supply and 80.2% received at least 55 lpcd, but only 76.0% of samples passed (Figure 2).
A back-of-envelope extension, which is my own calculation and not a published figure, shows what this implies. Applying 76% to 15.89 crore connected households gives about 12.1 crore with verified functional service, or 62.4% of all rural households (Figure 1). Adding the 3.46 crore households with no connection leaves roughly 7.3 crore, about 38%, without it. The survey covered only villages already declared “Har Ghar Jal”, and 411 of them (2.07%) had no household tap at all and were dropped (DDWS, 2024), so the true gap could be wider.
Where the binding constraint sits
“Functional” fails for different reasons in different places (Maps 1 and 2, Table 3). Quality is the weakest of the three dimensions in 18 of 34 states and Union Territories, including Gujarat (47.3% of samples passing), Tripura (31.1%), Kerala (56.4%), Madhya Pradesh (63.3%) and Uttar Pradesh (66.4%). Quantity binds in 10, most severely in Sikkim (24.5% of households at 55 lpcd), Mizoram (59.6%) and Rajasthan (60.1%). Regularity binds in 6, led by Bihar, where 59.0% of households receive water on schedule and only 61.4% had water from the tap in the previous week (DDWS, 2024). Gujarat is the clearest case against equating coverage with service: it was reported at full rural coverage (PTI, 2024), yet only 47.3% of its taps qualify as functional. Territories sampled on fewer than 100 villages carry wide margins (asterisked in Table 3).
Table 3. Functionality of household tap Connections by state, 2024 (% of households or samples)
Quality and source: what looks clean is not always safe
Perception hides the quality problem. In the same survey 92.4% of households were satisfied with water quality and 73.2% said their water needed no treatment, yet 24.0% of household samples failed microbiological tests (DDWS, 2024). At the source, only 80.9% of samples met all eleven chemical limits, falling to 47.0% in Gujarat, 51.7% in Rajasthan, 55.4% in Madhya Pradesh and 60.0% in Maharashtra. Arsenic and fluoride in groundwater are largely geogenic (MoJS, 2023), and 14,020 habitations in six states were arsenic-affected when the mission began (MoJS, via Toxics Link). A pipe cannot remove either. Monitoring is thin: only 27.2% of villages have field test kits and 70.3% have chlorination (DDWS, 2024). Intermittent supply also forces households to store water, which can contaminate it (CEDA, n.d.). Public institutions fare slightly worse: 68.0% of schools, Anganwadis and health centres have taps and 72.8% of their samples are microbiologically safe.
Audit evidence from the administrative side
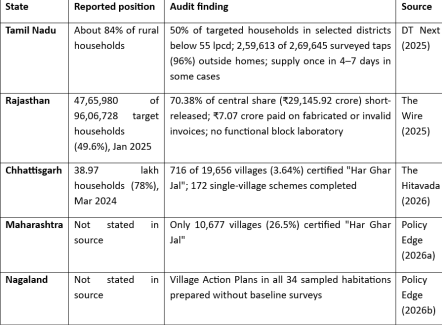
State audits by the Comptroller and Auditor General (CAG) show the same gap fro
Table 4. Selected CAG performance audit findings (period to March 2024)
Institutions, maintenance and money
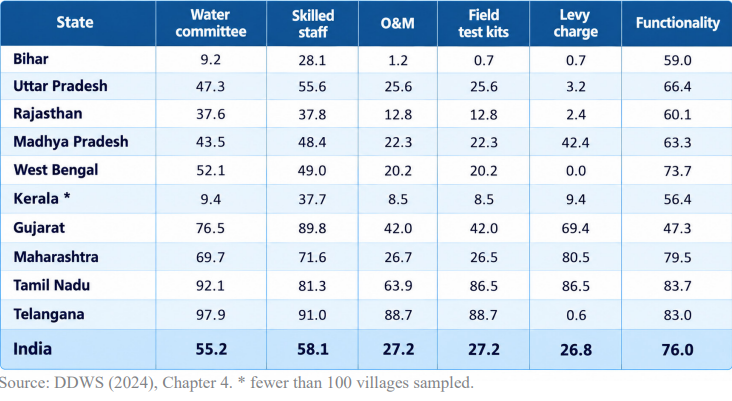
Non-functional taps trace mainly to maintenance, not to source failure. Households without a working tap cited damaged pipes (31.9%), pump failures (29.6%) and electricity problems (8.5%), and only 4.6% a source drying up (DDWS, 2024). The institutions that should prevent these failures are uneven: 55.2% of villages have a water committee, 58.1% skilled maintenance staff and 26.8% a user charge (Table 5). Bihar combines some of the weakest December 2028,institutions in the table (9.2% committees, 28.1% skilled staff) with 59.0% functionality, while Tamil Nadu pairs 92.1% committees and 86.5% charging with 83.7%. The link is not clean, though. Gujarat has strong institutions yet the lowest functionality of any large state, because of water chemistry and microbiology, and Telangana reaches 83.0% while only 0.6% of its villages levy a charge. Institutions matter, but they cannot substitute for safe sources.
Table 5. Village-level institutions in selected states, 2024 (% of villages)
Money follows the same story. The 2025-26 revised estimate for JJM was ₹17,000 crore, 75% below the ₹67,000 crore budgeted, and six states had recovered only ₹12 crore of ₹129 crore in penalties (PRS, 2026). The 2026-27 allocation is ₹67,670 crore, the second-largest centrally sponsored scheme (PRS, 2026). JJM 2.0 responds with the extension to December 2028, community handover under “Jal Arpan”, and a rule that a panchayat can certify “Har Ghar Jal” only after local maintenance arrangements are confirmed (Drishti IAS, 2026). PRS noted that guidelines for the extension had not yet been published.
What the literature says
The evidence falls into three strands: a shift in measurement from asset counts to service levels (Bhaduri, 2026; DDWS, 2024); fiscal and governance analysis of budgeting and enforcement (PRS, 2026; Sengupta, 2025); and audit evidence on planning and certification (Table 4). This note draws on official assessments, audits and policy commentary. Peerreviewed work on the health effects of tap access was not reviewed and is the natural next step. Bhaduri (2026) also notes that the 2024 round did not analyse tariffs or equity by social group.
Measuring what matters
Three changes would make reporting match the mission’s promise. Headline coverage should be published as verified functional coverage, the product of connection rate and functionality rate, with the weakest test named for each state. Future survey rounds should be disaggregated by Scheduled Caste and Scheduled Tribe households, hamlet periphery and water-scarce areas, and should add tariff, collection and expenditure indicators for maintenance. Quality should be treated as a condition of “functional” status, with chlorination, field test kits and accredited testing required before a village is certified. Until then, “Har Ghar Jal” describes where the pipes are, and “Har Ghar Paani” remains the standard still to be met.
About the Author:
Subhanshu Jaiswal is Assistant Manager – MLE at DevInsights, a research, monitoring, evaluation, and learning (RMEL) organization that generates evidence to support informed decision-making in the social development sector.
Clear Cut WASH Desk
New Delhi, UPDATED: November 05, 2026 16:00 IST
Written By: Subhanshu Jaiswal
Designation: Assistant Manager – MLE at Devinsights