
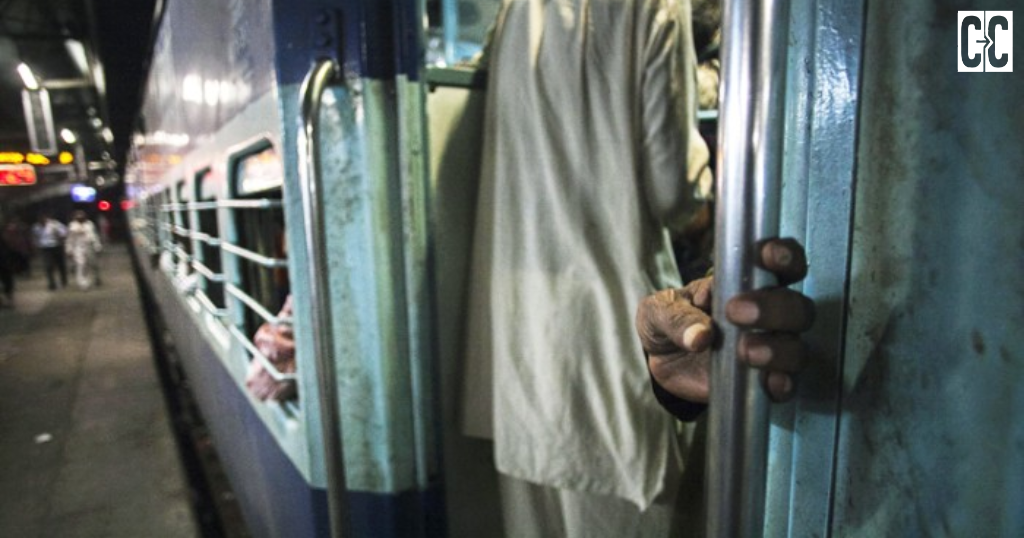
Every night at 9:30, a twelve-coach train leaves Bathinda for Bikaner. Roughly a third of its passengers are cancer patients. This is not a story about a train. It is a story about what government data from the Central Ground Water Board, the Ministry of Agriculture, and the ICMR tells us about the relationship between the way India grows its food and the health of the people who grow it.
The Train That Started a National Conversation
The Bathinda-Bikaner train has been running for decades. But the nickname it carries the “Cancer Train” is newer, born from the grim observation that a disproportionate share of its passengers are travelling not for work or family but to reach a hospital where they can afford treatment for a disease that has become a defining feature of life in Punjab’s Malwa belt.
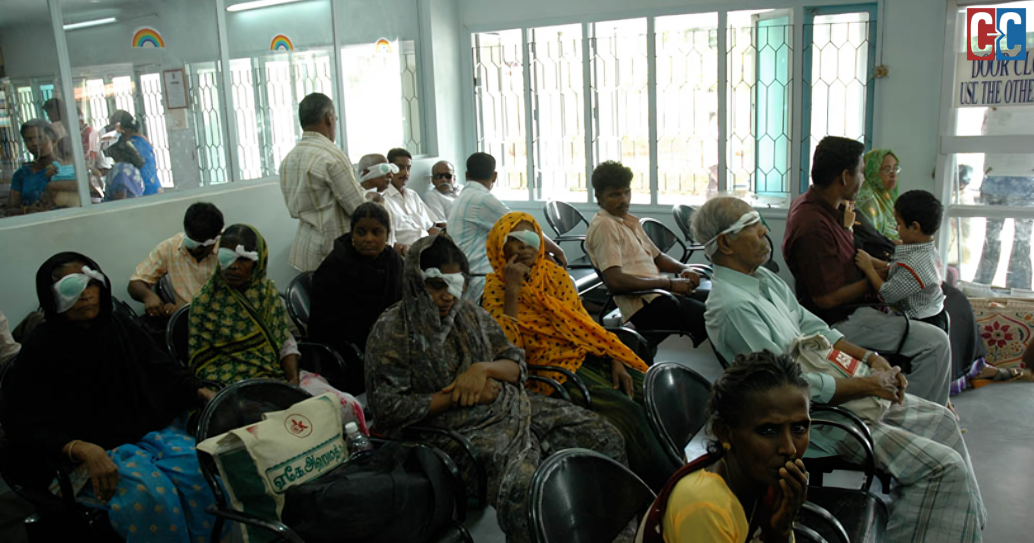
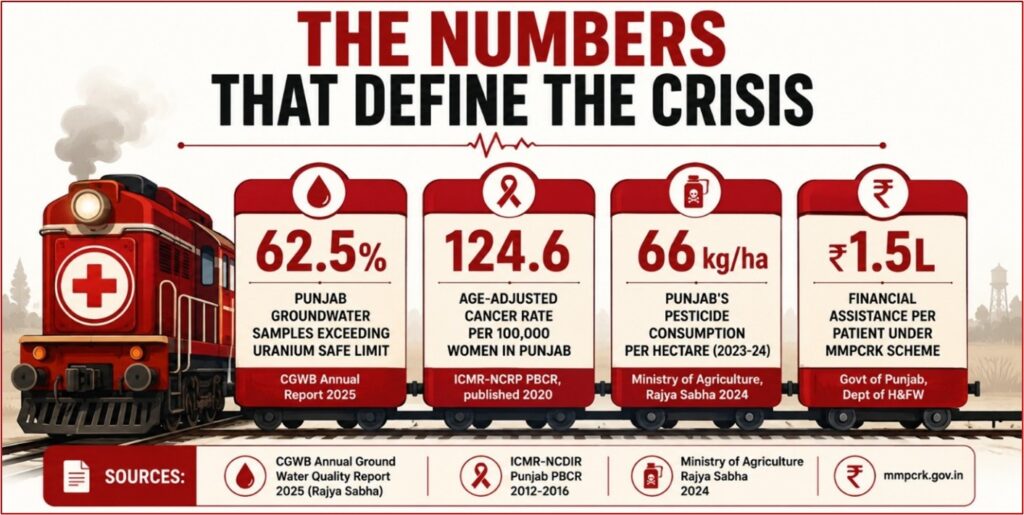
The train leaves Bathinda at 9:30 every night. It covers about 325 kilometres before arriving in Bikaner around 6 in the morning. On a typical journey, roughly a third of the 300 passengers are cancer patients or the family members accompanying them carrying plastic folders of medical papers, headed for the Acharya Tulsi Regional Cancer Treatment and Research Institute in Bikaner. They come from all over Punjab. They make the journey because Bikaner’s hospital is among those empanelled under the Mukh Mantri Punjab Cancer Raahat Kosh Scheme, which provides up to ₹1.5 lakh in financial assistance for cancer treatment to Punjab residents who cannot otherwise afford it.
The scheme exists because the disease is real and widespread. The question that has occupied researchers, courts, and Parliament for two decades is a harder one: why does Punjab have cancer rates that the ICMR’s own published registry data show significantly above the national average? And what does the Central Ground Water Board’s own annual monitoring data show is in the water that Punjab’s farming families have been drinking for decades?
What the ICMR’s Own Data Shows
India’s systematic cancer data is collected through the National Cancer Registry Programme, run by the ICMR’s National Centre for Disease Informatics and Research in Bengaluru. Punjab’s Population-Based Cancer Registry, based in Amritsar, is the primary source for the state’s official cancer statistics.The most recently validated and publicly released dataset from the Punjab PBCR covers the period 2012 to 2016 and was published in 2020. It is not a new study or an activist report. It is a government-standard population-based cancer surveillance document. What it shows is this: the Age-Adjusted Rate of cancer incidence for women in Punjab is 124.6 per 100,000 approximately 21 per cent above the national average of 102.9 per 100,000 reported by ICMR and GLOBOCAN data. For men, the AAR is 108.2 per 100,000, which is 16 per cent above the national male average.
The mortality-to-incidence ratio the proportion of diagnosed patients who ultimately die from the disease is 28.5 per cent in rural Punjab versus 24.3 per cent in urban Punjab, a statistically significant difference. Researchers attribute this gap to delayed diagnosis in rural areas, geographic inaccessibility of oncology services, and limited health-seeking behaviour. The cancer train is, in part, a product of this geography: rural patients who might have accessed treatment closer to home if the facilities existed, instead board a night train to Rajasthan.
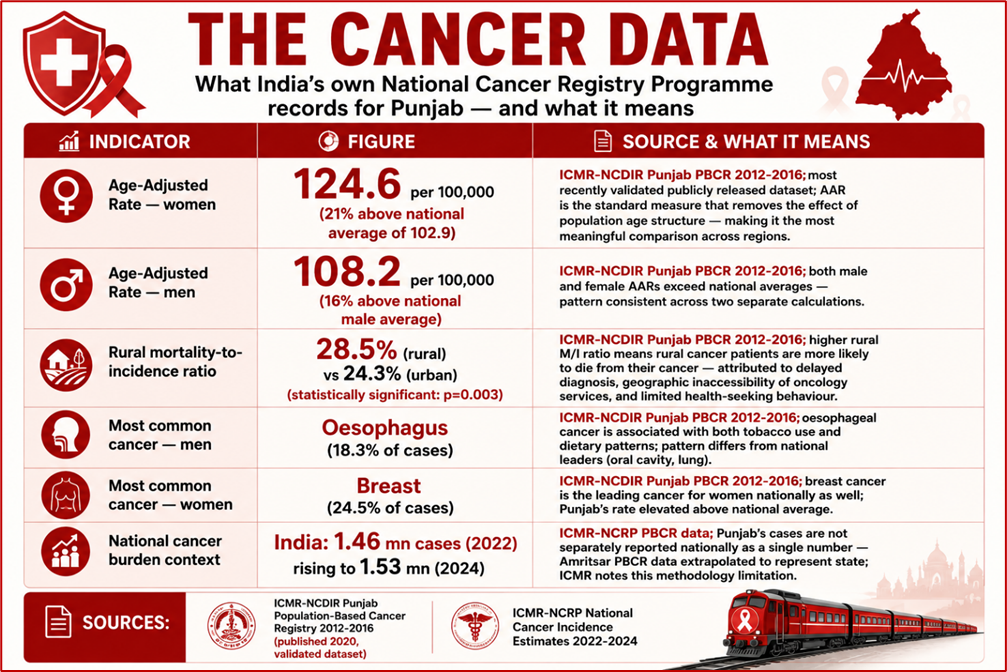
FIG. 1 THE CANCER DATA
The ICMR data has a recognised limitation that researchers themselves acknowledge: the post-2016 data for Punjab has not yet been fully published or validated. There is a quality assurance lag built into the PBCR process deduplication, mortality linkage, and verification take years. The 2012-2016 dataset is the definitive government-validated benchmark. It shows Punjab significantly above national averages. What has happened to that gap since 2016 is not yet captured in publicly available official data.
“This is a public health emergency. In more than half of the samples, uranium is above 30 ppb, which is causing cancer and kidney diseases in our future generations.
— Rajya Sabha MP Satnam Singh Sandhu, citing CGWB Annual Ground Water Report 2025, Parliament 2026
What the Central Ground Water Board Finds in Punjab’s Wells
The Central Ground Water Board is not an advocacy organisation. It is the apex technical body for groundwater management in India, functioning under the Ministry of Jal Shakti. Every year it publishes an Annual Ground Water Quality Report based on systematic sampling from thousands of monitoring locations across the country.
The 2024 CGWB report, based on 15,259 monitoring locations and released in December 2024, found uranium levels exceeding the safe limit of 30 parts per billion in 20 of Punjab’s districts. Bathinda the station where the cancer train begins its journey is explicitly named as one of India’s 15 most-affected districts for nitrate contamination.
By the time the 2025 CGWB report data was cited in the Rajya Sabha, the situation had worsened measurably. Uranium now exceeded 30 ppb in 53 per cent of pre-monsoon samples and 62.5 per cent of post-monsoon samples in Punjab the highest contamination rate for uranium in any state in India. Two districts, Sangrur and Bathinda, recorded concentrations exceeding 200 parts per billion, more than six times the safe limit.The CGWB’s own reports identify a contributing mechanism for the uranium contamination in Punjab: phosphate fertilisers. CGWB data notes that phosphate fertilisers contain uranium concentrations ranging from 1 mg/kg to 68.5 mg/kg, and that over time, this seeps into groundwater particularly in overexploited groundwater zones where falling water levels expose older geological channels with naturally higher uranium concentrations.
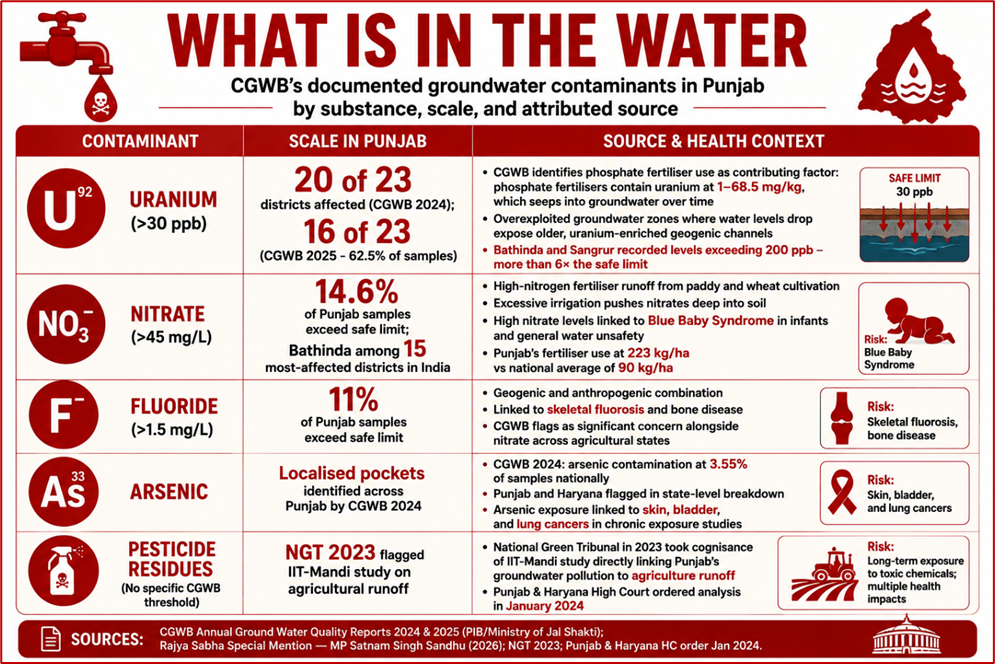
Water with uranium concentrations above 30 ppb, as the Tribune reported citing the CGWB data, is not safe for drinking and has been associated with urinary tract cancer and kidney toxicity. The Punjab and Haryana High Court ordered a comprehensive groundwater quality analysis in January 2024. The National Green Tribunal, in 2023, took cognisance of an IIT-Mandi study directly linking Punjab’s groundwater pollution to agricultural runoff.
How Punjab’s Agriculture Got Here
Punjab’s agricultural transformation began in the 1960s, when the Green Revolution made the state India’s food bowl. New high-yielding varieties of wheat and rice required heavy inputs: synthetic fertilisers, pesticides, and irrigation. The productivity gains were real and historically significant. Punjab fed a food-insecure nation.
The input intensity that came with it was equally real. By 1985, according to records cited in The Tribune’s historical coverage, Punjab was using nearly three times more fertiliser per lakh hectare than the national average, and the highest quantity of pesticides in the country nearly four times the national average. The wheat-paddy monoculture that drove these numbers became self-reinforcing: paddy, a water-intensive crop not naturally suited to Punjab’s climate, nonetheless dominated because of procurement price support and sunk investment in irrigation infrastructure.
Sixty years later, the Ministry of Agriculture’s own data shows the inherited pattern. Punjab’s fertiliser consumption at 223 kg per hectare is more than double the national average of 90 kg. Its pesticide use at 66 kg per hectare in 2023-24 is the highest per-hectare figure in India. Its adoption of biopesticides is 11th in the country, at 193 metric tonnes per year.
THE AGRICULTURAL INPUT PICTURE
What Ministry of Agriculture data reveals about Punjab’s farming practices and their scale
| Input / practice | Scale | What official data reveals |
| Fertiliser use | 223 kg/ha (Punjab) vs 90 kg/ha national average; top consumer by per-hectare metric in India | Ministry of Agriculture data, Rajya Sabha 2024; Paddy and wheat require high nitrogen-phosphate-potash inputs; Punjab’s cropping intensity exceptionally high; phosphate fertilisers contain uranium that leaches into groundwater directly linking agricultural practice to CGWB’s documented contamination |
| Pesticide consumption | 5,270 MT total in 2023-24 at 66 kg/ha; third highest total volume nationally but highest per hectare | Ministry of Agriculture, Rajya Sabha 2024; Punjab has 1.5% of India’s landmass but historically consumed 17% of its pesticides; per-hectare pesticide use highest in India 66 kg/ha vs significantly lower rates in states of comparable agricultural intensity |
| Bio-pesticide adoption | Only 193 MT per annum; Punjab ranks 11th nationally | Ministry of Agriculture Annual Report 2023-24; state adoption of safer alternatives remains very low despite government push; stark contrast with chemical pesticide intensity |
| Crop pattern | Wheat-paddy monoculture dominates 78.71 lakh hectares gross cropped area | Ministry of Agriculture; paddy is a water-intensive crop not naturally suited to Punjab’s climate; monoculture drives sustained high chemical input requirements; state government has taken measures for crop diversification but paddy-wheat cycle dominates |
| Organic farming | ~7,000 hectares under certified organic farming | Ministry of Agriculture 2024; represents 0.009% of Punjab’s gross cropped area marginal relative to the chemical-intensive system across the rest of the state |
Sources: Ministry of Agriculture and Farmers Welfare, Rajya Sabha reply (Jul 2024); MoAFW Annual Report 2023-24; Tribune India reporting of Parliament data.
The state government has taken measures to promote crop diversification and reduce paddy-wheat dependence. These are genuine efforts. But the certified organic land under cultivation in Punjab around 7,000 hectares as of the Ministry of Agriculture’s most recent data represents less than a hundredth of a per cent of Punjab’s 78.71 lakh hectare gross cropped area. The dominant agricultural system has not changed at the pace that the contamination data suggests is necessary.
The Causal Question: What We Know and What Remains Uncertain
It is important to be precise about what official data does and does not establish. The CGWB documents that Punjab’s groundwater has extremely high levels of uranium, nitrate, fluoride, and arsenic contaminants that are, in significant part, attributable to intensive agricultural input use. The ICMR’s cancer registry documents that Punjab’s cancer incidence rates are meaningfully above national averages. These are established facts from the government’s own data.
What the government’s own published data does not establish is a direct, peer-reviewed causal chain between specific agricultural chemicals and specific cancer outcomes in Punjab. Establishing that chain requires epidemiological studies with matched controls, long-term cohort data, and exposure assessments that have not been conducted at the scale needed for definitive conclusions. The ICMR’s post-2016 Punjab PBCR data has not yet been published. The government’s own data shows elevated rates and contaminated water; it does not yet provide the causal proof.
What the data does establish is enough to warrant urgent action under the precautionary principle. A state where the central government’s own water authority documents uranium at six times the safe limit in its major agricultural districts, and where the central government’s own cancer registry shows incidence rates 16 to 21 per cent above national averages, has a documented public health risk that does not require causal certainty before demanding a response. A Rajya Sabha MP has already called this a “public health emergency” on the floor of Parliament, citing the government’s own CGWB numbers.
The Policy Response: What the State Has Built and What It Hasn’t
Punjab’s government has not been passive in the face of the cancer burden. The Mukh Mantri Punjab Cancer Raahat Kosh Scheme, launched in 2011 and documented on the NITI Aayog’s NFS portal as a state best practice, provides financial assistance of up to ₹1.5 lakh per patient at 21 empanelled hospitals. The reason that Bikaner’s Acharya Tulsi Regional Cancer Treatment and Research Institute is a destination for Punjab’s patients is precisely because it is empanelled under this scheme the scheme is why poor patients can afford to make the 325-kilometre journey, and why they are willing to board a night train rather than go without treatment.
Beyond the MMPCRK scheme, the Punjab government’s broader Mukh Mantri Sehat Yojana provides health coverage up to ₹10 lakh per family. Both schemes represent a real, funded effort to manage the treatment side of the cancer burden. Neither addresses the environmental side.
POLICY RESPONSE VS. PREVENTION GAP
What India’s government policies address and the structural gap between treatment and source reduction
| Policy / intervention | What it does | What it does not address |
| Mukh Mantri Punjab Cancer Raahat Kosh Scheme (est. 2011) | Financial assistance up to ₹1.5 lakh per patient for cancer treatment; available at 21 empanelled hospitals (10 govt, 11 private); cashless, paperless system via NIC; includes Bikaner’s Acharya Tulsi Hospital which is why poor patients from Punjab travel there | The scheme is demand-driven; it funds patients after cancer is diagnosed, not before; it does not address prevention, environmental monitoring, or source reduction of agricultural inputs causing contamination |
| Mukh Mantri Sehat Yojana | Broader health coverage up to ₹10 lakh per family for Punjab residents | Cancer treatment partially covered; does not address the environmental and agricultural inputs generating the disease burden; healthcare spending responds to disease rather than eliminating its causes |
| CGWB National Aquifer Mapping Programme (NAQUIM) | Aquifer mapping with attention to groundwater quality including arsenic and fluoride contamination | CGWB 2024 and 2025 annual quality reports document worsening contamination in Punjab; Rajya Sabha MP has called for a Special Groundwater Mitigation Mission; CGWB monitoring is ongoing but remediation infrastructure has not followed at scale |
| Punjab & Haryana HC / NGT interventions | HC ordered groundwater quality analysis (Jan 2024); NGT took cognisance of IIT-Mandi agriculture runoff study (2023) | Judicial interventions acknowledge the problem; no executive action to reduce fertiliser or pesticide inputs in the Malwa belt has been documented as a direct consequence; state government measures focus on crop diversification, not immediate input reduction |
| Ministry of Agriculture crop diversification | Punjab government measures to reduce paddy-wheat dependency; organic farming push; 7,000 ha certified organic land | 7,000 ha organic out of 78.71 lakh ha gross cropped area represents 0.009%; no timeline for systemic reduction of pesticide and fertiliser inputs documented in official sources |
Sources: Govt of Punjab MMPCRK (mmpcrk.gov.in); NITI Aayog NFS Portal; PIB/CGWB (2025); Ministry of Agriculture Rajya Sabha 2024; Punjab & Haryana HC Jan 2024; NGT 2023.
The asymmetry is structural. Treatment programmes can be funded by state budgets, managed by hospitals, and measured by patient numbers. Reducing the uranium in Punjab’s groundwater requires coordinated action across the Ministry of Jal Shakti, the Ministry of Agriculture, the state government, and ultimately the farming community that depends on the current input-intensive system for its livelihood. It also requires acknowledging, at the political level, a connection between agricultural practice and public health that is uncomfortable for a state whose agricultural identity is inseparable from the Green Revolution legacy.
The Train as Evidence
The Bathinda-Bikaner train is, in the end, a piece of evidence. Not evidence of malice or conspiracy, but evidence of a system that has produced a disease burden and then built a workaround for it: a scheme that funds treatment at a distant hospital, accessed by a night train, taken by families whose soil and water carry what decades of intensive farming left behind.
The government data is clear in its separate parts. The CGWB says Punjab’s groundwater is among the most contaminated in India, and that fertiliser use is a contributing factor. The Ministry of Agriculture says Punjab uses more fertiliser and more pesticide per hectare than almost any other state in India. The ICMR’s cancer registry says Punjab’s cancer rates are significantly above the national average, with rural patients dying at a higher rate than urban ones.
What the data does not say yet because the epidemiological studies connecting these observations with the rigor that causal claims require have not been fully published is precisely which chemicals are producing which cancers in which populations at what doses. That is the research that the ICMR’s expanded registry programme, and the renewed attention following the parliamentary debate, could produce in the coming years.
What the precautionary principle says, in the meantime, is that a state with uranium at six times the safe limit in its drinking water, and cancer rates 21 per cent above the national average among women, should not need to wait for that proof before accelerating action on both the agricultural inputs and the public health response.
The cancer train runs every night. It has been running for years. The question it asks of India’s policymakers why does a state that feeds the nation carry this burden? has been documented in government reports. It has been raised in Parliament. It has been taken up by courts. What it has not yet produced is a policy response proportionate to the scale of what the government’s own data shows.
Clear Cut Health Desk
New Delhi, UPDATED: August 08, 2026 17:00 IST
Written By: Shivangi Misra
Designation: Assistant Manager – MLE at Devinsights